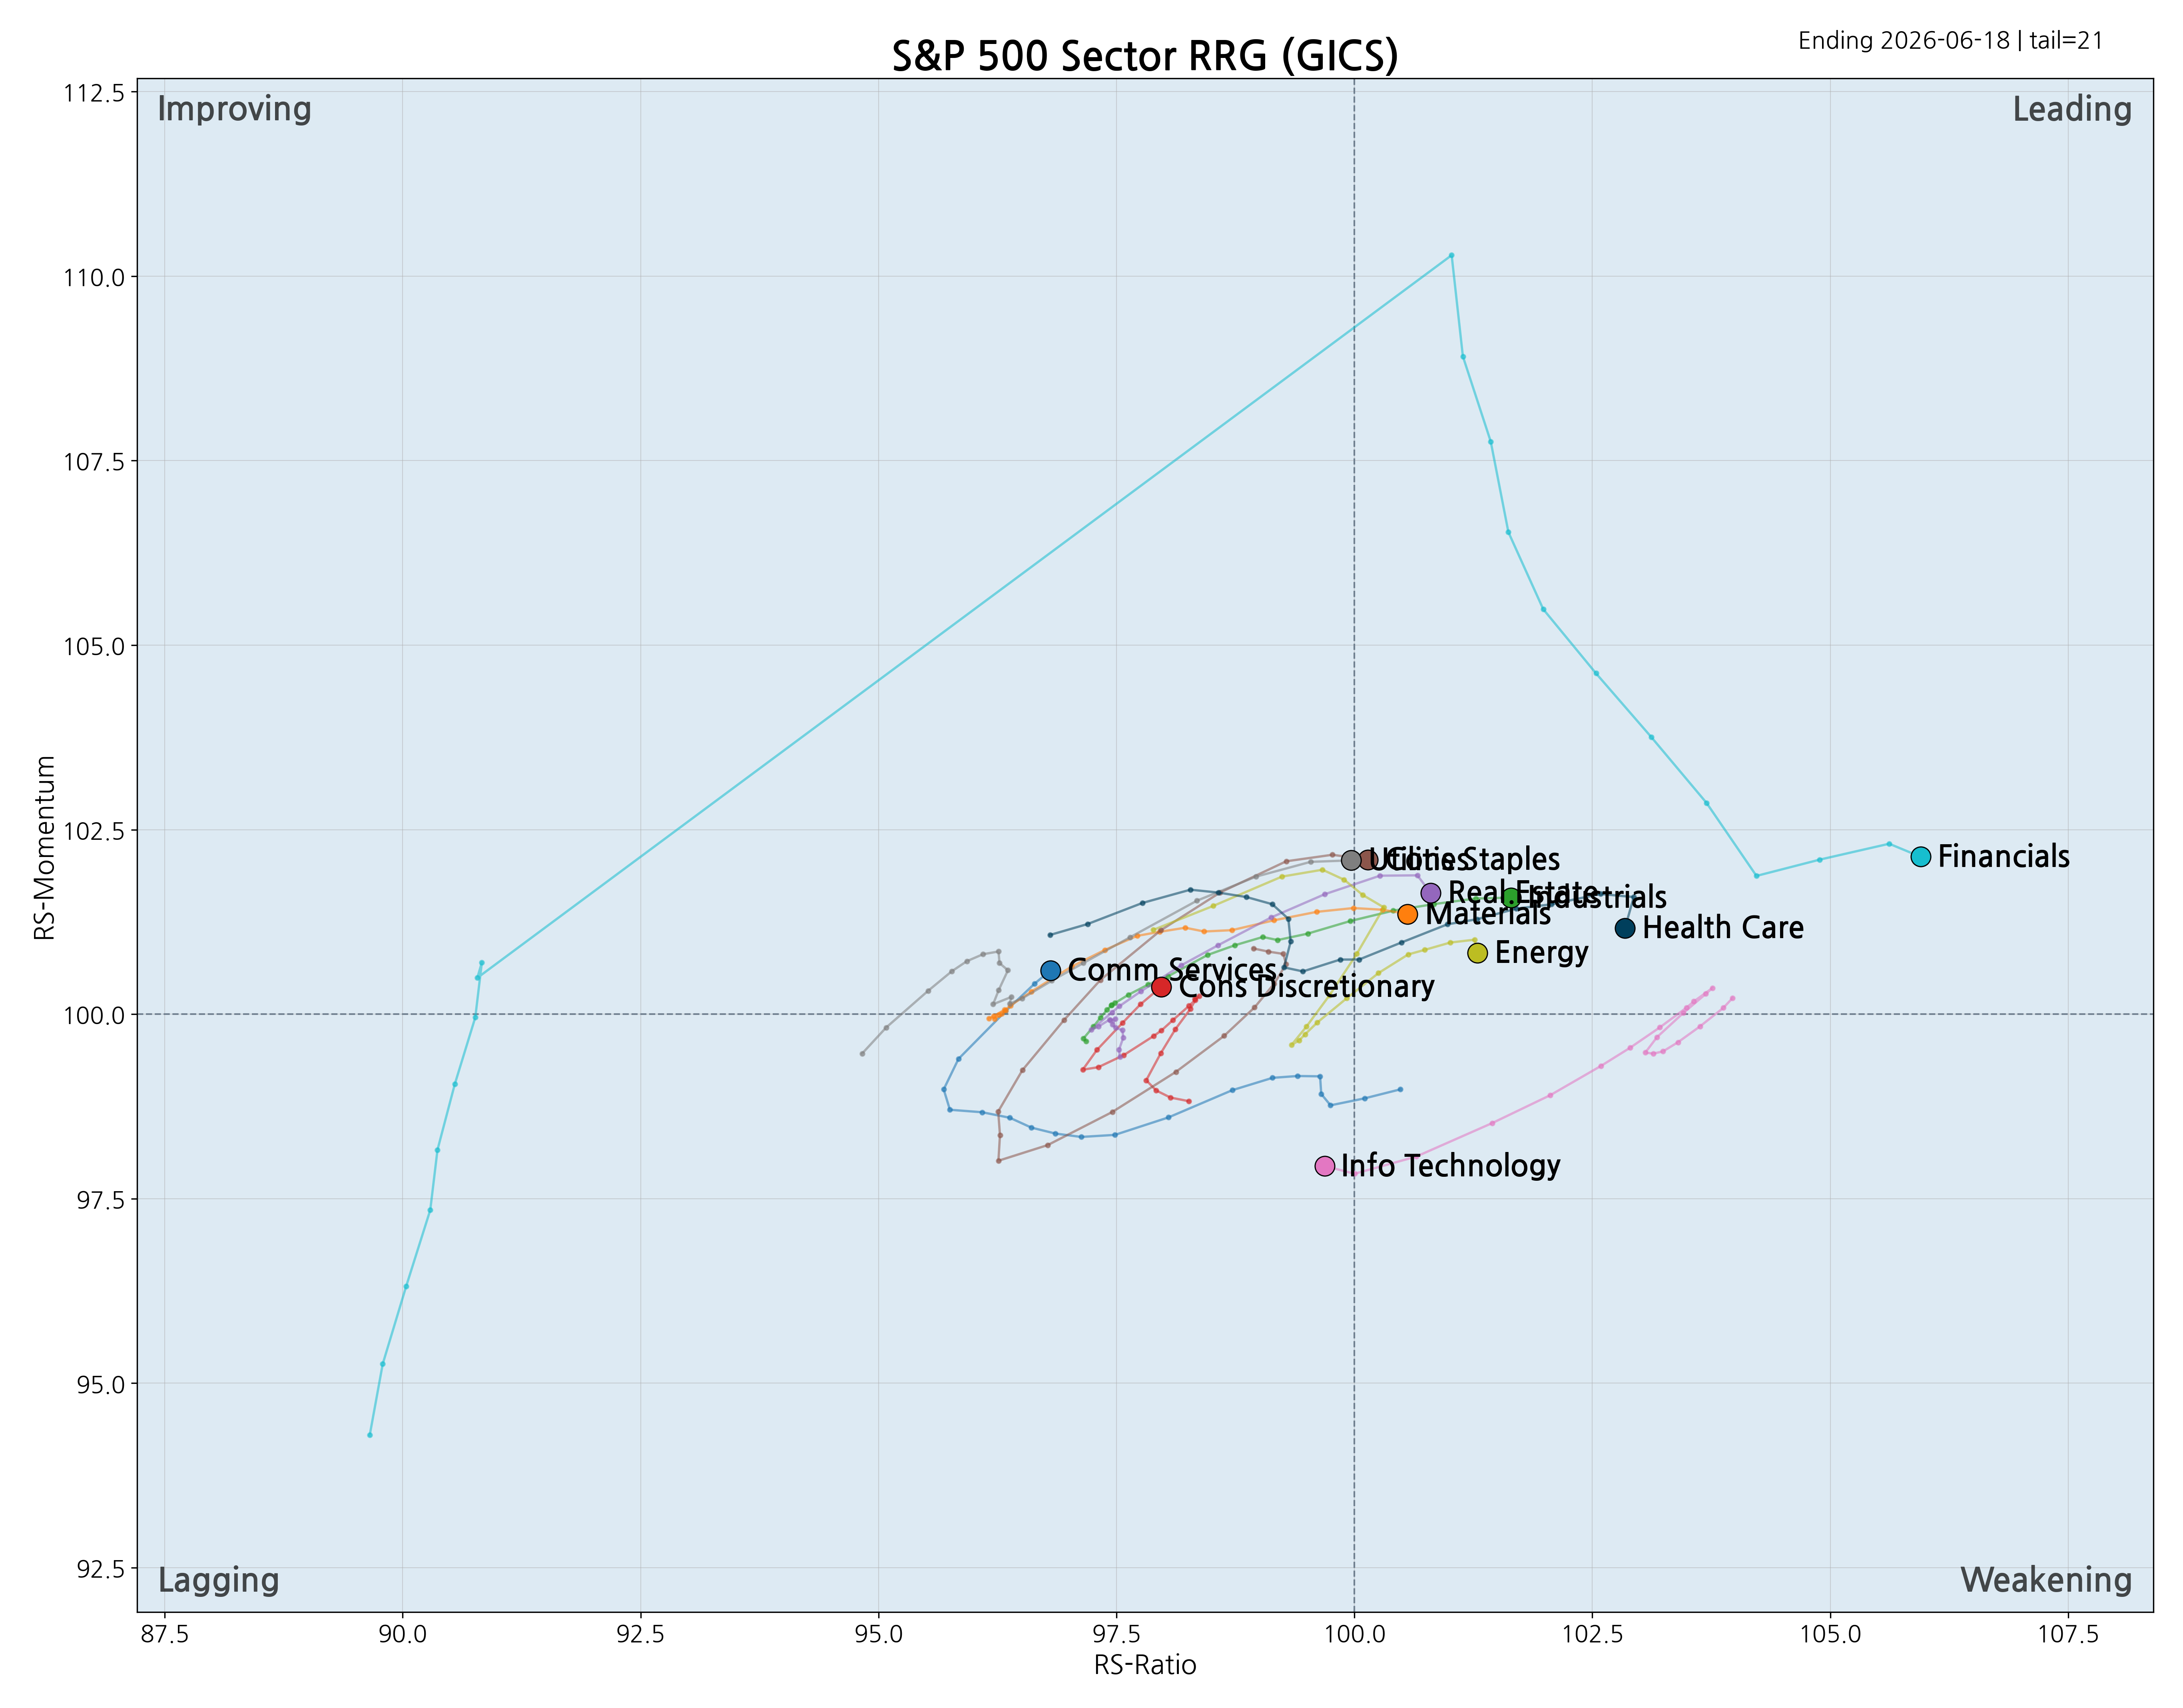
Sector Rotation
S&P 500 sector rotation. Each sector ETF's position shows its momentum and relative strength vs the S&P 500 benchmark.
Source updated 2026-07-03 07:03 KST · click image to view full size
Sector exposure
GICS sector exposure for active sector-rotation ETFs. Latest pull: 2026-07-05 · Previous: Monday 2026-06-22
| Sector | XLSR | AESR | SECT | INRO |
|---|---|---|---|---|
| Comm Services | 23.6% | 22.6% | 11.5% | 8.8% |
| Cons Discretionary | 4.8% | 12.4% | 12.3% | 11.5% |
| Cons Staples | 4.9% | 2.3% | 0.5% | 6.4% |
| Energy | 6.2% | 1.8% | 4.3% | 2.4% |
| Financials | 0.0% | 6.3% | 14.7% | 9.7% |
| Health Care | 0.0% | 2.5% | 2.6% | 8.0% |
| Industrials | 18.8% | 8.0% | 11.2% | 9.3% |
| Info Technology | 41.7% | 38.2% | 38.2% | 41.1% |
| Materials | 0.0% | 1.4% | 4.4% | 1.9% |
| Real Estate | 0.0% | 0.3% | 0.0% | 0.3% |
| Utilities | 0.0% | 0.4% | 0.1% | 0.1% |
| Cash/Other | -0.0% | 4.0% | 0.2% | 0.4% |
| Total | 100.0% | 100.0% | 100.0% | 100.0% |
| Sector | XLSR | AESR | SECT | INRO |
|---|---|---|---|---|
| Comm Services | — | — | -10.5%p (1.0%) | — |
| Cons Discretionary | — | — | -12.3%p (0.0%) | — |
| Cons Staples | — | — | (0.5%) | — |
| Energy | — | — | -0.5%p (3.8%) | — |
| Financials | — | — | +2.6%p (17.3%) | — |
| Health Care | — | — | -2.3%p (0.3%) | — |
| Industrials | — | — | +0.8%p (12.0%) | — |
| Info Technology | — | — | +6.0%p (44.2%) | — |
| Materials | — | — | -0.4%p (4.0%) | — |
| Real Estate | — | — | (0.0%) | — |
| Utilities | — | — | +5.9%p (6.0%) | — |
| Cash/Other | — | — | +10.7%p (10.9%) | — |
| Total | — | — | 100.0% | — |