Absolute Trend-Following AA
Current Allocation
| Category | Security | Ticker | Weight | vs prev month-end |
|---|---|---|---|---|
| Bond | iShares Core US Agg Bond | AGG | 14.3% | 0.0%p |
| Cash | Cash (SHY/T-bills) | Cash | 14.3% | +14.3%p |
| Equity | iShares Core MSCI Intl Developed | IDEV | 14.3% | 0.0%p |
| Equity | iShares Core MSCI Emerging Mkts | IEMG | 14.3% | 0.0%p |
| Equity | SPDR S&P 500 | SPY | 14.3% | 0.0%p |
| Real Asset | Invesco Optimum Yield Commodity | PDBC | 14.3% | 0.0%p |
| Real Asset | Vanguard Real Estate | VNQ | 14.3% | 0.0%p |
| Real Asset | SPDR Gold Shares | GLD | 0.0% | -14.3%p |
Weight change vs previous month-end rebalance (2026-05-31).
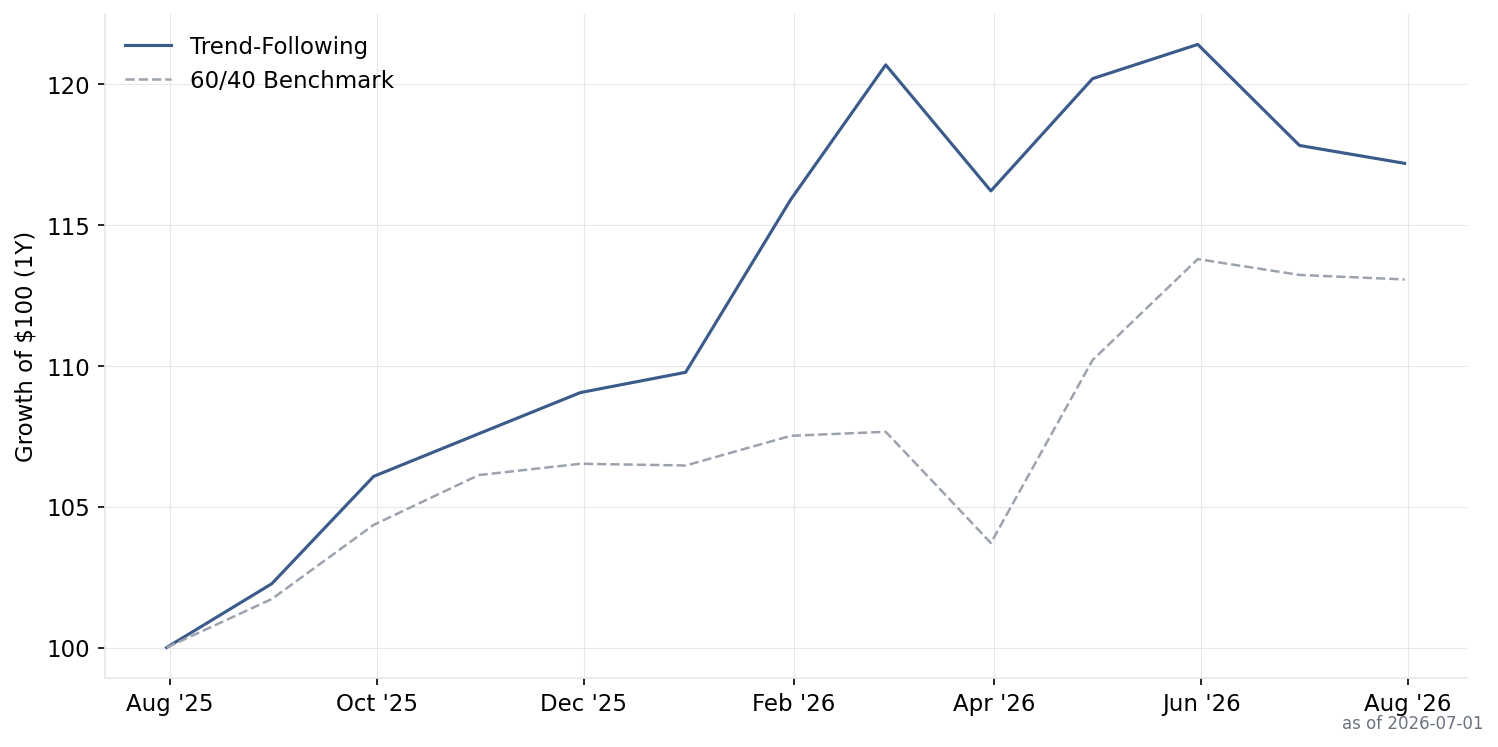
Performance vs 60/40
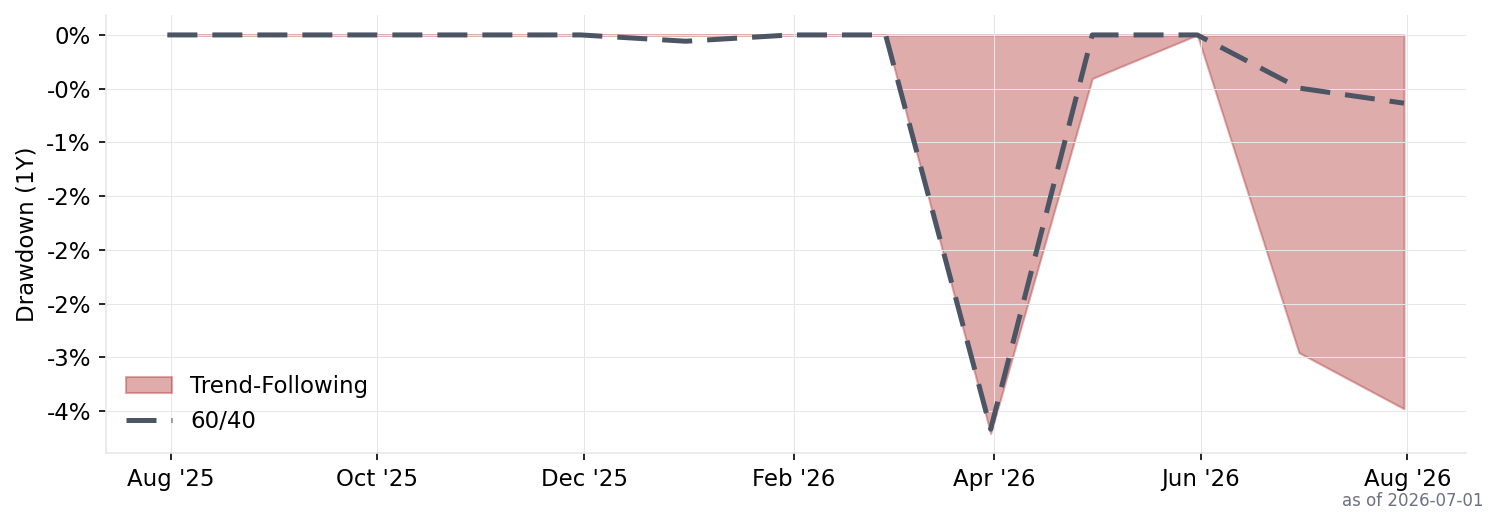
Drawdown
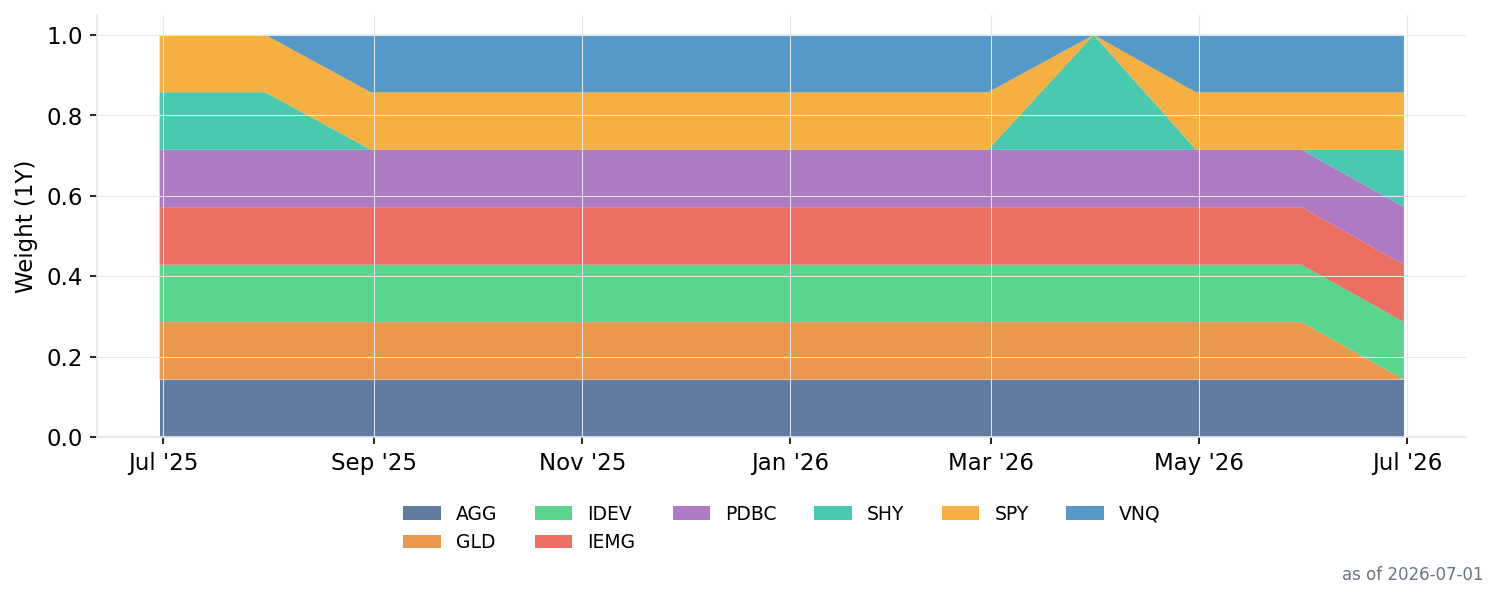
Allocation History
Latest month-end signals
Signals are evaluated once a month at month-end; they do not update intraday.
| Asset | Security | Price | SMA10M | Signal | Signal Date |
|---|---|---|---|---|---|
| SPY | SPDR S&P 500 | 745.76 | 701.58 | RISK-ON | 2026-07-31 |
| IDEV | iShares Core MSCI Intl Developed | 88.61 | 84.88 | RISK-ON | 2026-07-31 |
| IEMG | iShares Core MSCI Emerging Mkts | 80.63 | 74.03 | RISK-ON | 2026-07-31 |
| AGG | iShares Core US Agg Bond | 98.5 | 98.32 | RISK-ON | 2026-07-31 |
| VNQ | Vanguard Real Estate | 96.82 | 91.66 | RISK-ON | 2026-07-31 |
| GLD | SPDR Gold Shares | 370.6 | 409.11 | CASH | 2026-07-31 |
| PDBC | Invesco Optimum Yield Commodity | 15.78 | 15.41 | RISK-ON | 2026-07-31 |
Strategy Details
Mebane Faber's GTAA (Global Tactical Asset Allocation) strategy from his 2007 Journal of Wealth Management paper. The core idea is simple: hold a diversified basket of asset classes, but only when each asset is in an uptrend. When an asset falls below its long-term moving average, that sleeve moves to cash. This avoids riding bear markets in any single asset class while capturing broad upside across equities, bonds, real estate, and commodities.
Asset Universe
- Risk Assets
- SPY (US equity), IDEV (Int'l developed), IEMG (Emerging markets), AGG (US bonds), VNQ (REITs), GLD (Gold), PDBC (Commodities)
- Cash
- SHY (US short-term Treasuries)
Scoring Formula
Trend Signal = Price vs. 10-Month Simple Moving Average (SMA)
Decision Rules
- Equal-weight 7 asset classes at 1/7 (~14.3%) each
- Each month: if asset price > 10-month SMA → hold the asset
- If asset price ≤ 10-month SMA → move that sleeve to cash (SHY)
- Rebalance all sleeves simultaneously at month-end
Source
Mebane Faber, 'A Quantitative Approach to Tactical Asset Allocation', Journal of Wealth Management, 2007 — Paper
Caveats
- IDEV data starts 2017-03-23, limiting backtest history.
- IEMG data starts 2012-10-24, limiting backtest history.
- PDBC data starts 2014-11-07, limiting backtest history.
Data: Alpha Vantage (prices), FRED (unemployment). Transaction cost: 5bps/trade. Backtest: 2017-03-31 to 2026-07-01. Generated: 2026-07-02 09:30:54.