Bond — Growth

The path to GDP, not the stale print — core sub-metrics over headlines, nominal series deflated to real, and the consumer judged on whether spending is funded by income or by drawing down savings.

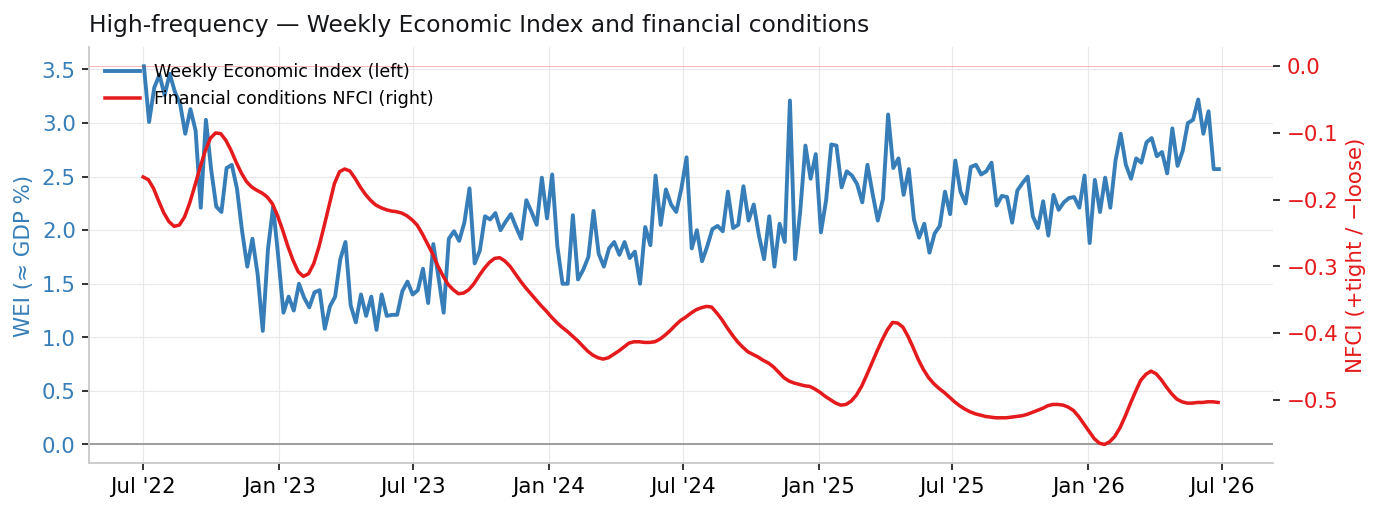
Updated 2026-07-05 08:36 KST · GDPNow 2026-04-01 · monthly through 2026-05-01 · weekly 2026-06-27 · source: FRED

Reads the path to GDP, not the stale quarterly print. Core sub-metrics over headlines (retail control group, core capex), nominal series deflated to real, and the consumer judged on sustainability — is spending funded by income or by drawing down savings. Soft-data leads hard. Licensed surveys not on FRED (ISM, S&P Global PMI, LEI, NAHB, NFIB) are crawled from their official releases into a local store.

GDP nowcast
+1.2%
Atlanta Fed · Q2 2026
Atlanta Fed GDPNow, current-quarter real GDP (SAAR). FRED carries the quarterly nowcast; intra-month updates not shown.
Investment nowcast
+6.5%
real private investment
GDPNow's real gross private investment component — which subcomponent is moving the nowcast.
Growth vs trend
-0.03
CFNAI · 3-mo avg
Chicago Fed National Activity Index (3-mo avg, 85 indicators, mean 0). ≤ −0.70 flags recession risk; > +0.70 is hot.
Nowcast cross-check
+1.5%
St. Louis news index
St. Louis Fed news-index GDP nowcast — secondary reference vs GDPNow.

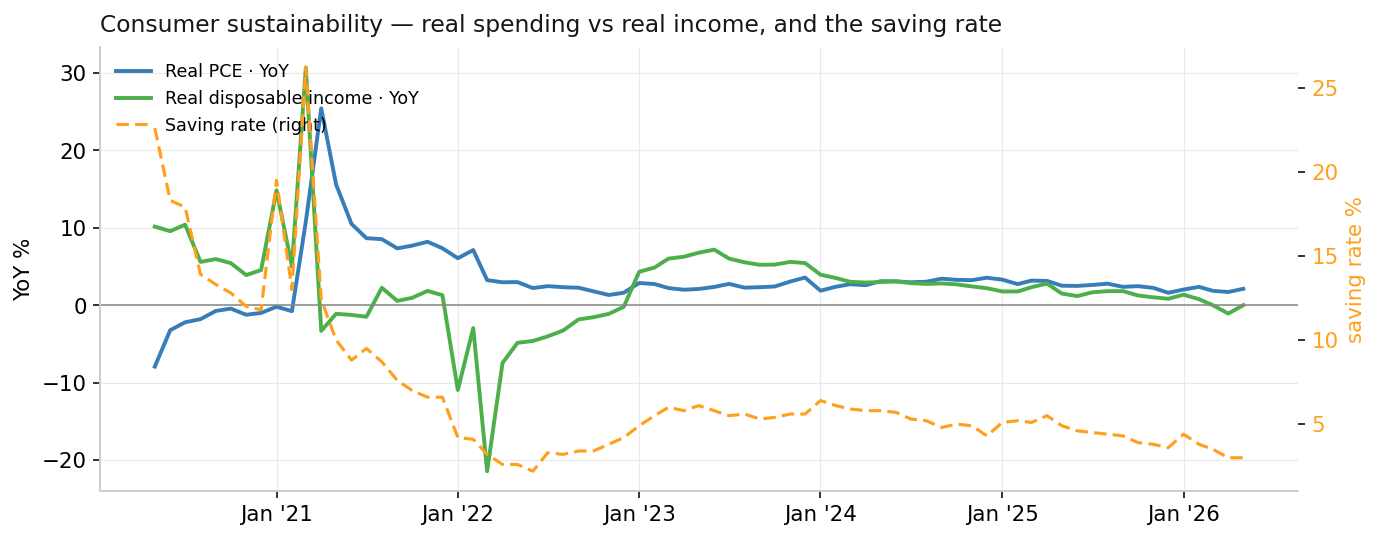
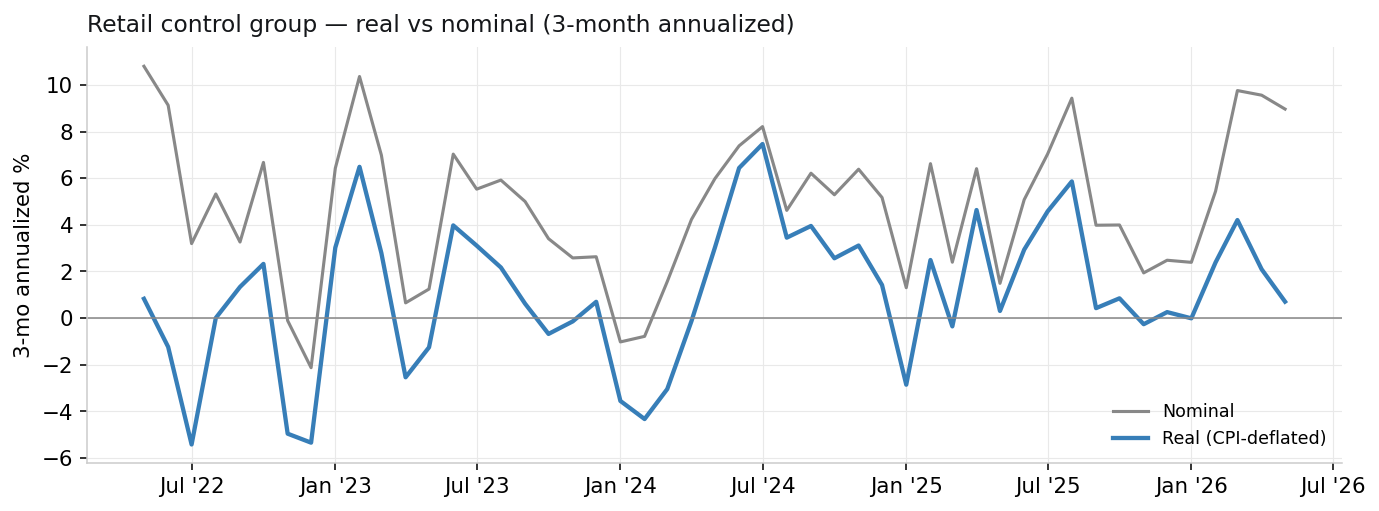
The consumer ~70% of GDP

The control group strips out the noisy bits (autos, gas, building materials, restaurants). Watch the real read, not nominal — and whether spending is outrunning income.
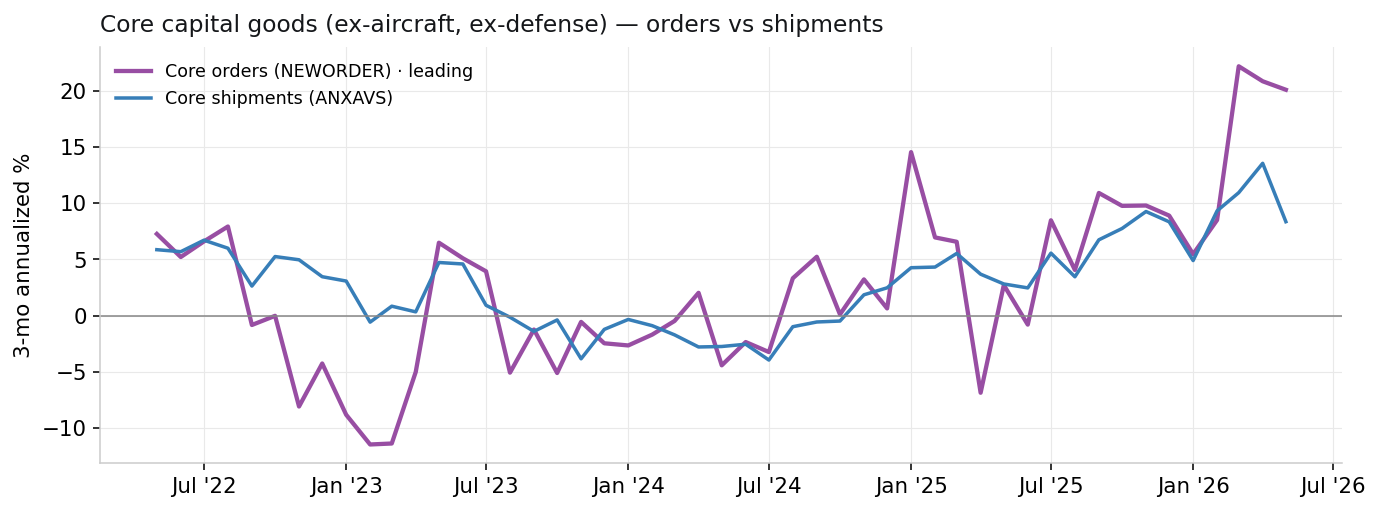
Control group · real+0.28%MoM · nominal +0.75%
Real PCE · YoY+2.1%MoM +0.26%
Real income · YoY0.0%disposable
Sustainability gap+2.1ppspend − income
Saving rate3.0%
PCE prices · YoY+4.1%Fed-preferred
Card delinquency2.92%2026-01-01
Vehicle sales16.9MSAAR
Real spending vs real income and the saving rate
Real PCE vs real disposable income (YoY) and the saving rate. Spending above income + a low saving rate = funded by savings/credit = fragile.
Retail control group, real vs nominal
Retail control group, 3-month annualized — real (CPI-deflated) vs nominal. A positive nominal / negative real gap is the key tell.

Business investment

Core capital goods — nondefense ex-aircraft — not the Boeing-dominated headline. Orders lead shipments.

Core orders+20.1%3-mo annualized · leading
Core shipments+8.4%3-mo annualized
Core capital goods orders vs shipments
Core capital-goods orders (NEWORDER, leading) vs shipments (feeds GDP equipment investment). AI demand is the live theme.

Production

Industrial production+1.7%YoY · MoM +0.14%
Capacity utilization76.2%
Industrial production and capacity utilization
The hard output the surveys try to anticipate — industrial production (YoY) and capacity utilization.

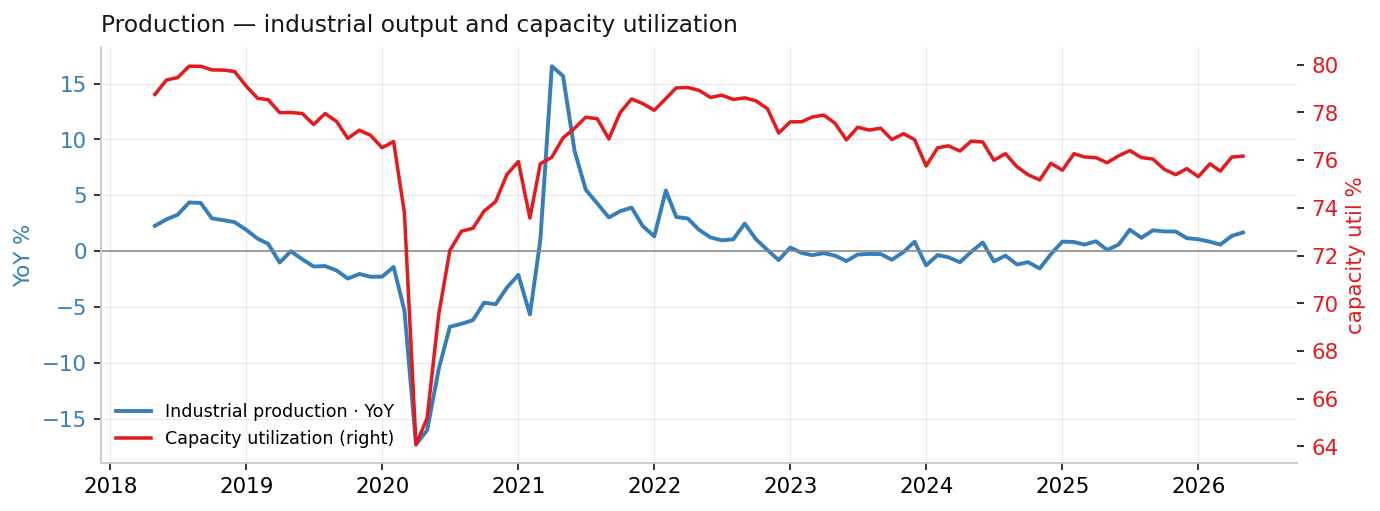
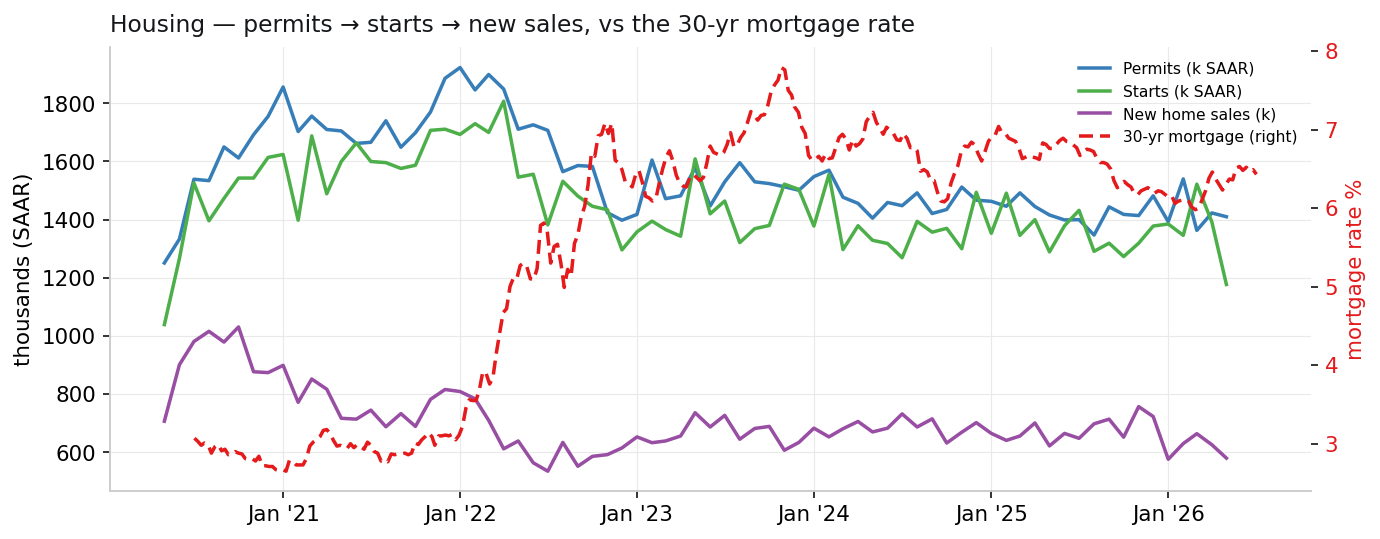
Housing leading cyclical

Read in lead order: permits → starts → new sales, driven by the mortgage rate.

Permits1kSAAR
Starts1kSAAR
New home sales1k
Existing sales4.17M
30-yr mortgage6.43%
Housing permits, starts, sales and mortgage rate
Permits → starts → new sales vs the 30-year mortgage rate. NAHB builder sentiment (the earliest read) is an external series, not yet wired.

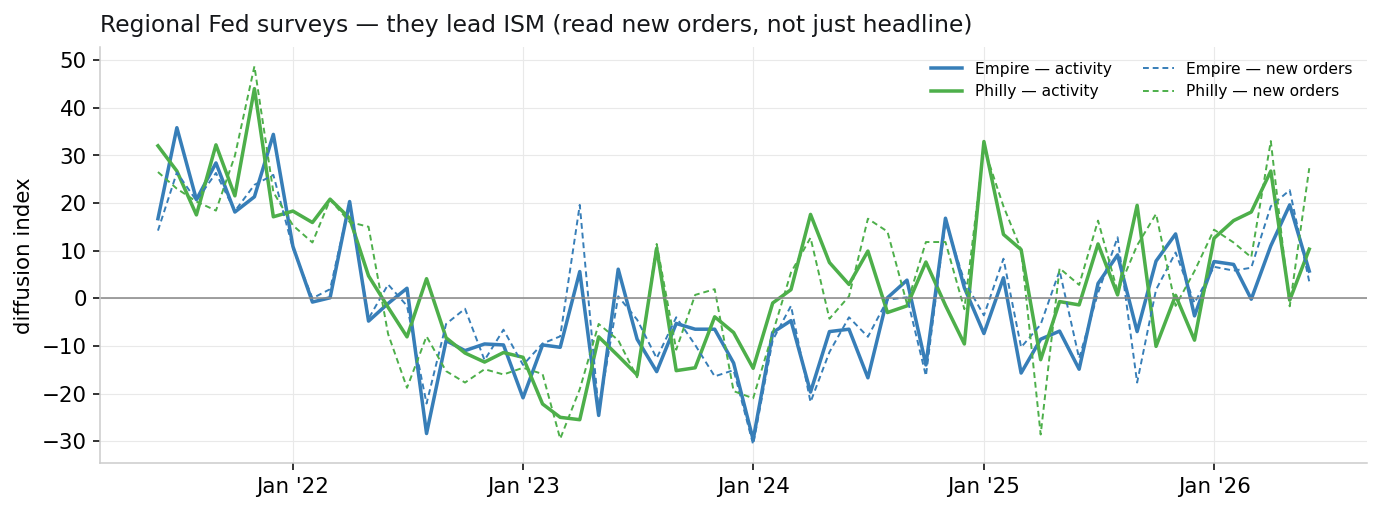
Soft-data leading edge

Regional Fed surveys (on FRED) lead ISM. Read the new-orders sub-component, not just the headline.

Empire · activity5.7new orders 3.5
Philly · activity10.3new orders 27.3
Philly · shipments14.9
Regional Fed manufacturing surveys
Empire State and Philadelphia Fed — general activity (solid) and new orders (dashed). These print ahead of ISM each month.

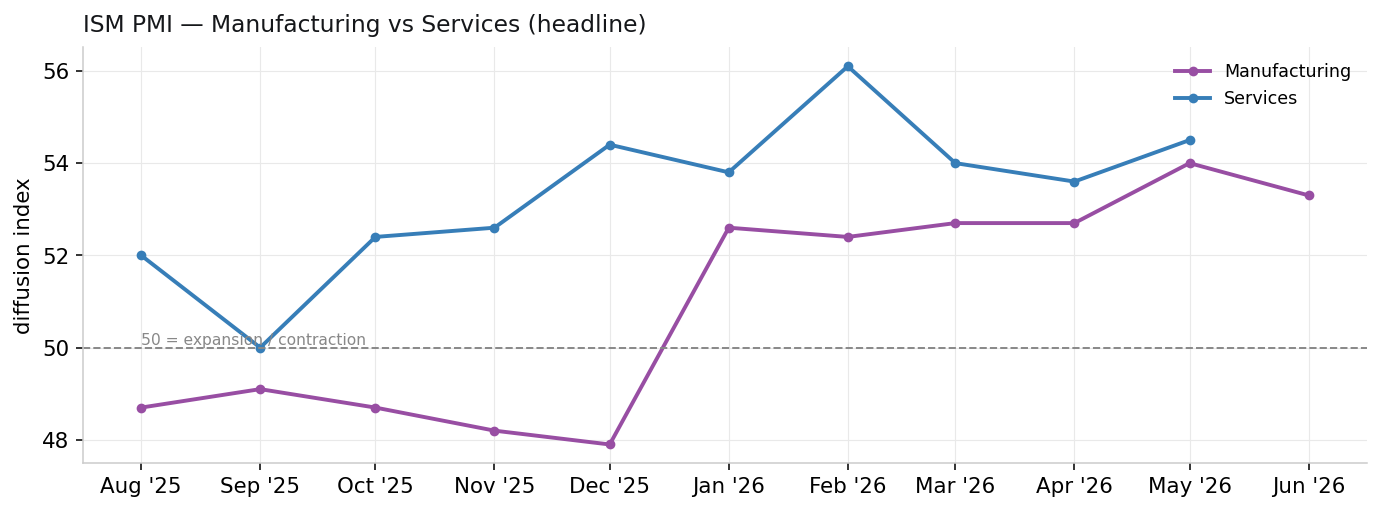
ISM PMI 2026-06-01 · crawled

Read New Orders (the leader) and Prices (early inflation). New Orders − Inventories is the cleanest forward tell. 50 = expansion threshold.

ISM Manufacturing 53.3 Growing
New Orders 56.0
Prices 73.0
Employment 49.7
Supplier Deliveries 57.4
Orders − Inv +4.6
ISM Services 54.5 Growing
Business Activity 57.7
New Orders 57.3
Prices 71.3
Employment 47.9
Orders − Inv -5.2

From ISM's Report On Business (via PRNewswire), stored locally. History accumulates monthly.

ISM PMI history — manufacturing vs services
ISM headline PMI history — manufacturing crossed back above 50 in early 2026; services held in expansion.

S&P Global US PMI 2026-05-01 · crawled

An independent survey from ISM (different panel/methodology) — a useful cross-check. Flash prints ~a week before the final and ~10 days before ISM. 50 = expansion.

Manufacturing · final55.1
Services · final50.7
Composite · flash52.2output
Manufacturing · flash55.7
Services · flash51.3business activity

Leading & sentiment

Conference Board LEI, builder (NAHB) and small-business (NFIB) sentiment, and Cass freight volumes — the forward-looking edge.

Conference Board LEI99.3+0.1% MoM · 2026-05
NAHB builder HMI35present 38 · traffic 25
NFIB small-biz optimism95.32026-05
Cass freight · shipments-1.2%YoY · MoM +3%
Cass freight · expenditures+7.5%YoY

LEI / NAHB / NFIB crawled from their official releases and stored locally; Cass via FRED.

High-frequency

Weekly Economic Index2.57≈ GDP % · 2026-06-27
Financial conditions-0.50NFCI · −loose / +tight
Weekly Economic Index and financial conditions
Dallas Fed Weekly Economic Index and the Chicago Fed financial-conditions index — the heartbeat between monthly reports.