Country — Region
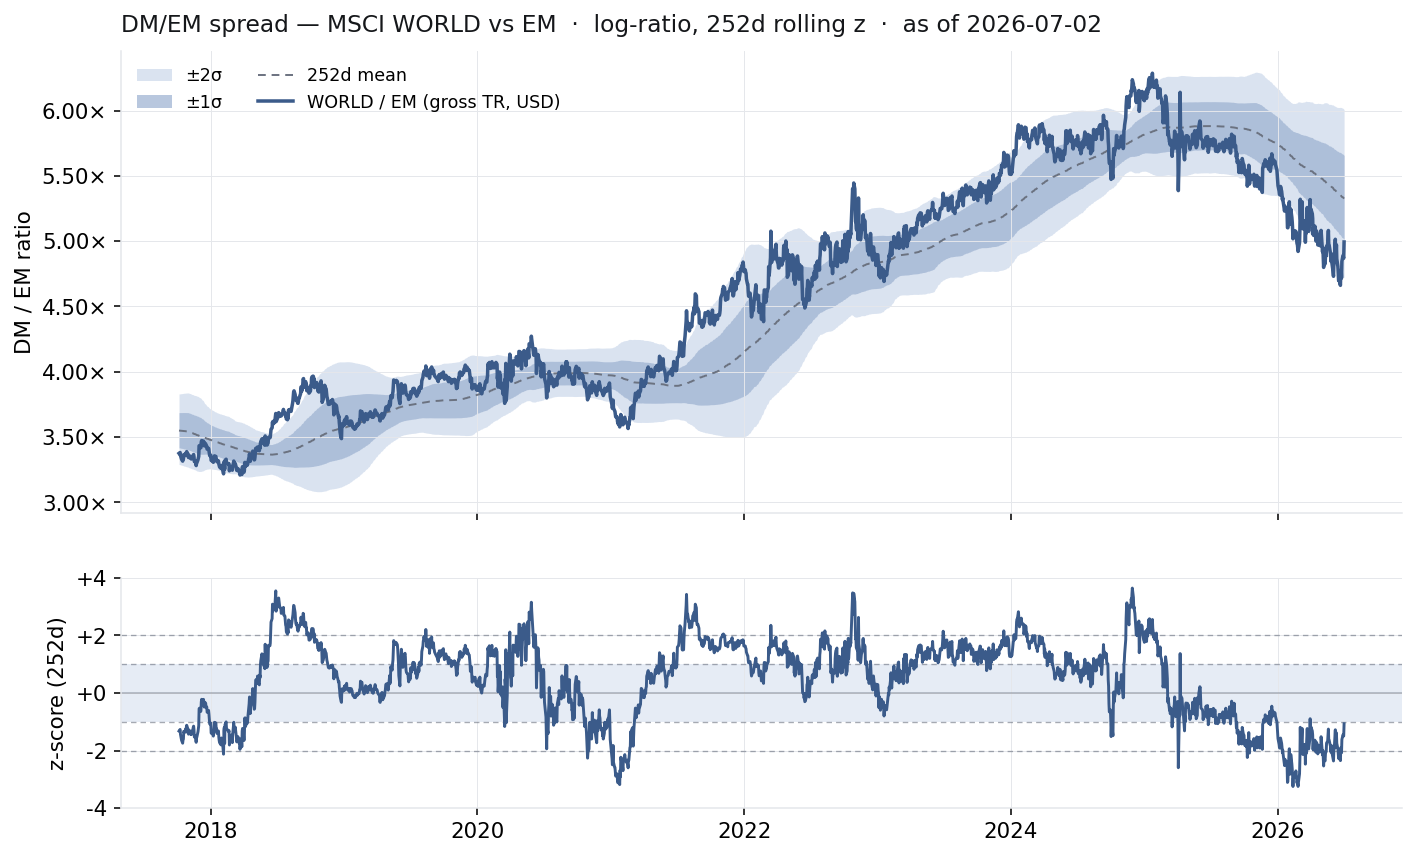
Region-level relative strength. The DM/EM spread tracks who is leading — developed (MSCI World) or emerging (MSCI EM) markets — and whether that leadership is stretched versus its own trailing-year regime.
Updated 2026-07-03 08:00 KST · data through-date on the chart · click image to view full size
Monthly Returns — Net TR, USD
MSCI country indices, net total return in USD. MTD = month-to-date; columns are the 12 most recent completed months; 12M compounds them. Through 2026-07-02.
| Market | MTD | 26-06 | 26-05 | 26-04 | 26-03 | 26-02 | 26-01 | 25-12 | 25-11 | 25-10 | 25-09 | 25-08 | 25-07 | 12M |
|---|---|---|---|---|---|---|---|---|---|---|---|---|---|---|
| DM (WORLD) | +0.1% | -0.7% | +4.6% | +9.6% | -6.4% | +0.7% | +2.2% | +0.8% | +0.3% | +2.0% | +3.2% | +2.6% | +1.3% | +21.3% |
| NETHERLANDS | -5.2% | +11.8% | +9.2% | +11.3% | -11.0% | +0.4% | +14.9% | +2.6% | -1.9% | +2.9% | +13.2% | +3.1% | -6.0% | +58.5% |
| AUSTRIA | +1.6% | +7.6% | +5.4% | +7.9% | -5.5% | -5.0% | +7.6% | +8.0% | +3.6% | +5.4% | +1.5% | +3.1% | +4.3% | +52.1% |
| SPAIN | +1.1% | +5.0% | +2.4% | +7.0% | -8.8% | +0.8% | +5.2% | +7.1% | +3.6% | +1.9% | +4.3% | +6.7% | +1.4% | +42.1% |
| BELGIUM | +0.3% | +4.1% | +6.2% | +6.1% | -9.6% | +1.5% | +7.1% | +0.9% | +4.9% | +1.8% | +1.1% | +6.4% | +0.5% | +34.4% |
| JAPAN | +0.9% | -0.3% | +5.0% | +9.2% | -12.4% | +8.6% | +6.6% | +0.5% | -0.7% | +3.4% | +2.4% | +7.0% | -1.4% | +29.1% |
| ITALY | +1.9% | +1.2% | +3.2% | +9.7% | -8.6% | +2.8% | +2.8% | +4.7% | +2.0% | -0.6% | +1.6% | +5.3% | +1.3% | +27.3% |
| CANADA | +0.3% | -1.9% | +1.0% | +7.0% | -5.6% | +6.1% | +1.1% | +3.0% | +4.2% | +0.3% | +3.7% | +5.5% | +0.3% | +26.9% |
| USA | -0.1% | -0.9% | +5.2% | +10.5% | -4.9% | -0.9% | +1.3% | -0.0% | -0.0% | +2.4% | +3.6% | +1.9% | +2.3% | +21.5% |
| UNITED KINGDOM | +2.3% | -0.8% | -0.3% | +5.2% | -7.7% | +5.1% | +5.2% | +3.8% | +1.4% | +1.7% | +1.3% | +3.7% | +0.9% | +20.3% |
| SWITZERLAND | +1.5% | +1.7% | +3.5% | +6.6% | -11.9% | +5.9% | +2.6% | +4.6% | +4.4% | +0.6% | -0.4% | +4.5% | -2.5% | +19.7% |
| ISRAEL | +0.7% | -11.5% | +7.0% | +10.4% | -2.8% | -3.0% | +8.7% | +6.4% | -0.8% | +0.4% | +6.0% | +3.5% | -5.1% | +18.3% |
| IRELAND | +0.5% | +1.5% | +4.2% | +6.9% | -9.4% | -2.1% | +1.3% | +3.7% | +9.5% | +0.6% | +4.7% | +0.9% | -3.5% | +18.2% |
| NORWAY | +1.5% | -13.1% | -0.2% | -1.0% | +9.5% | +9.0% | +10.2% | +5.1% | +0.6% | -4.4% | +1.8% | +3.2% | -4.2% | +14.9% |
| SWEDEN | +1.1% | -3.2% | +3.4% | +6.3% | -13.3% | +4.4% | +6.3% | +4.6% | -0.4% | +1.7% | +1.9% | +5.4% | -3.4% | +12.7% |
| AUSTRALIA | -0.5% | -2.8% | +1.0% | +7.0% | -10.0% | +7.6% | +6.6% | +3.6% | -3.4% | -1.0% | -0.3% | +3.7% | +0.1% | +11.1% |
| HONG KONG | +0.6% | -8.6% | -1.1% | +3.7% | -6.8% | +2.6% | +10.3% | -0.5% | +2.6% | +0.2% | +1.5% | +2.6% | +4.8% | +10.5% |
| FRANCE | +1.0% | +1.0% | +1.6% | +6.0% | -11.1% | +5.1% | +1.2% | +1.7% | +0.7% | +0.9% | +2.9% | +1.4% | -1.2% | +9.6% |
| NEW ZEALAND | +0.7% | -3.7% | +7.9% | +5.2% | -10.3% | +3.8% | +6.4% | +0.2% | -1.0% | +0.4% | +1.6% | -0.4% | -1.3% | +7.6% |
| GERMANY | +2.3% | -3.2% | +2.8% | +8.6% | -12.4% | +2.8% | +1.7% | +4.4% | +0.4% | -2.1% | -0.5% | +1.2% | -1.8% | +0.3% |
| DENMARK | +4.9% | +1.8% | +3.0% | +9.5% | -3.4% | -18.6% | +8.7% | +5.3% | +3.5% | -3.3% | -3.1% | +7.2% | -16.4% | -10.0% |
| EM | -2.2% | -1.4% | +9.7% | +14.7% | -13.1% | +5.5% | +8.9% | +3.0% | -2.4% | +4.2% | +7.2% | +1.3% | +1.9% | +43.5% |
| KOREA | -12.1% | +0.3% | +35.3% | +38.2% | -25.4% | +22.0% | +28.1% | +12.7% | -7.9% | +22.7% | +10.5% | -1.9% | +4.0% | +213.8% |
| TAIWAN | +1.7% | +1.2% | +16.5% | +26.2% | -13.0% | +12.8% | +11.1% | +5.8% | -5.0% | +9.8% | +9.4% | -0.8% | +5.4% | +105.0% |
| HUNGARY | +2.3% | +4.5% | +3.3% | +23.5% | -10.4% | -2.0% | +19.3% | +2.8% | +6.0% | +8.7% | -1.0% | +4.6% | +2.3% | +75.0% |
| THAILAND | -0.2% | -1.8% | +5.2% | +5.0% | -10.1% | +20.5% | +6.6% | +2.7% | -2.4% | +4.6% | +3.1% | -0.3% | +14.3% | +54.3% |
| MEXICO | +0.3% | -3.1% | +3.5% | +2.6% | -8.3% | +7.1% | +9.6% | +3.3% | +2.8% | -0.8% | +9.8% | +3.2% | -0.1% | +32.3% |
| SOUTH AFRICA | +1.4% | -6.8% | +2.4% | +2.8% | -18.6% | +9.6% | +8.2% | +9.1% | +4.0% | +0.5% | +12.1% | +6.7% | +0.7% | +30.2% |
| BRAZIL | +0.4% | -2.9% | -9.1% | +4.0% | -1.9% | +3.9% | +16.8% | -1.3% | +7.7% | +0.7% | +5.4% | +10.3% | -6.9% | +26.6% |
| UNITED ARAB EMIRATES | +0.8% | +3.3% | -1.4% | +6.7% | -16.3% | +3.7% | +7.0% | +5.6% | -6.6% | +4.5% | -2.9% | -4.3% | +9.7% | +6.0% |
| SAUDI ARABIA | +0.2% | -2.5% | -0.9% | -0.6% | +4.7% | -5.6% | +10.5% | -0.5% | -8.1% | +1.0% | +8.6% | -0.9% | -1.2% | +3.2% |
| PHILIPPINES | +1.8% | +8.2% | -1.1% | -2.3% | -14.0% | +7.3% | +5.0% | +1.1% | +2.2% | +0.1% | -5.2% | +1.8% | -4.4% | -3.6% |
| CHINA | +0.2% | -7.1% | -3.0% | +3.6% | -7.7% | -5.8% | +4.7% | -1.2% | -2.5% | -3.8% | +9.8% | +4.9% | +4.8% | -4.9% |
| INDIA | +0.4% | +1.5% | -0.6% | +9.2% | -14.9% | +1.4% | -5.1% | -0.5% | +0.9% | +4.4% | +0.5% | -3.1% | -5.1% | -12.8% |
| INDONESIA | +1.5% | -8.7% | -12.9% | -7.2% | -15.7% | -1.1% | -4.8% | -0.6% | +1.1% | +4.0% | -2.2% | +0.1% | -1.0% | -40.7% |
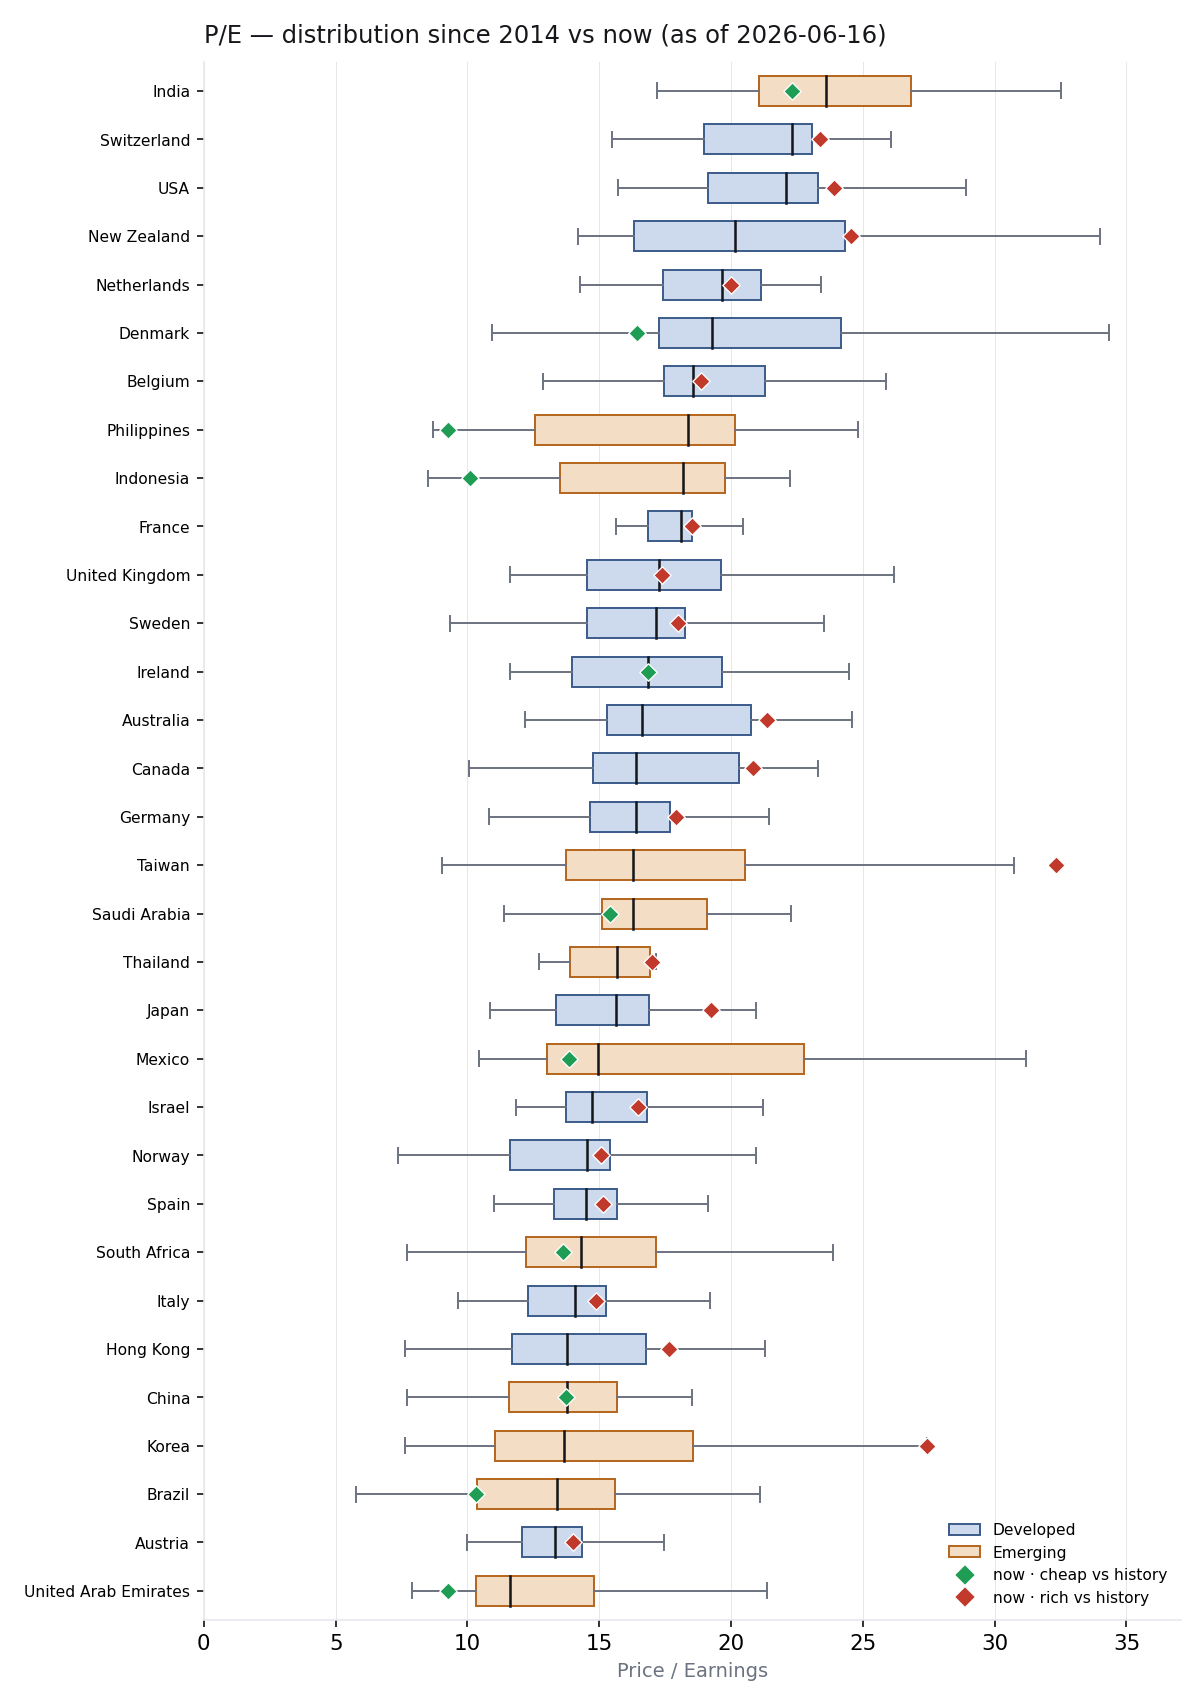
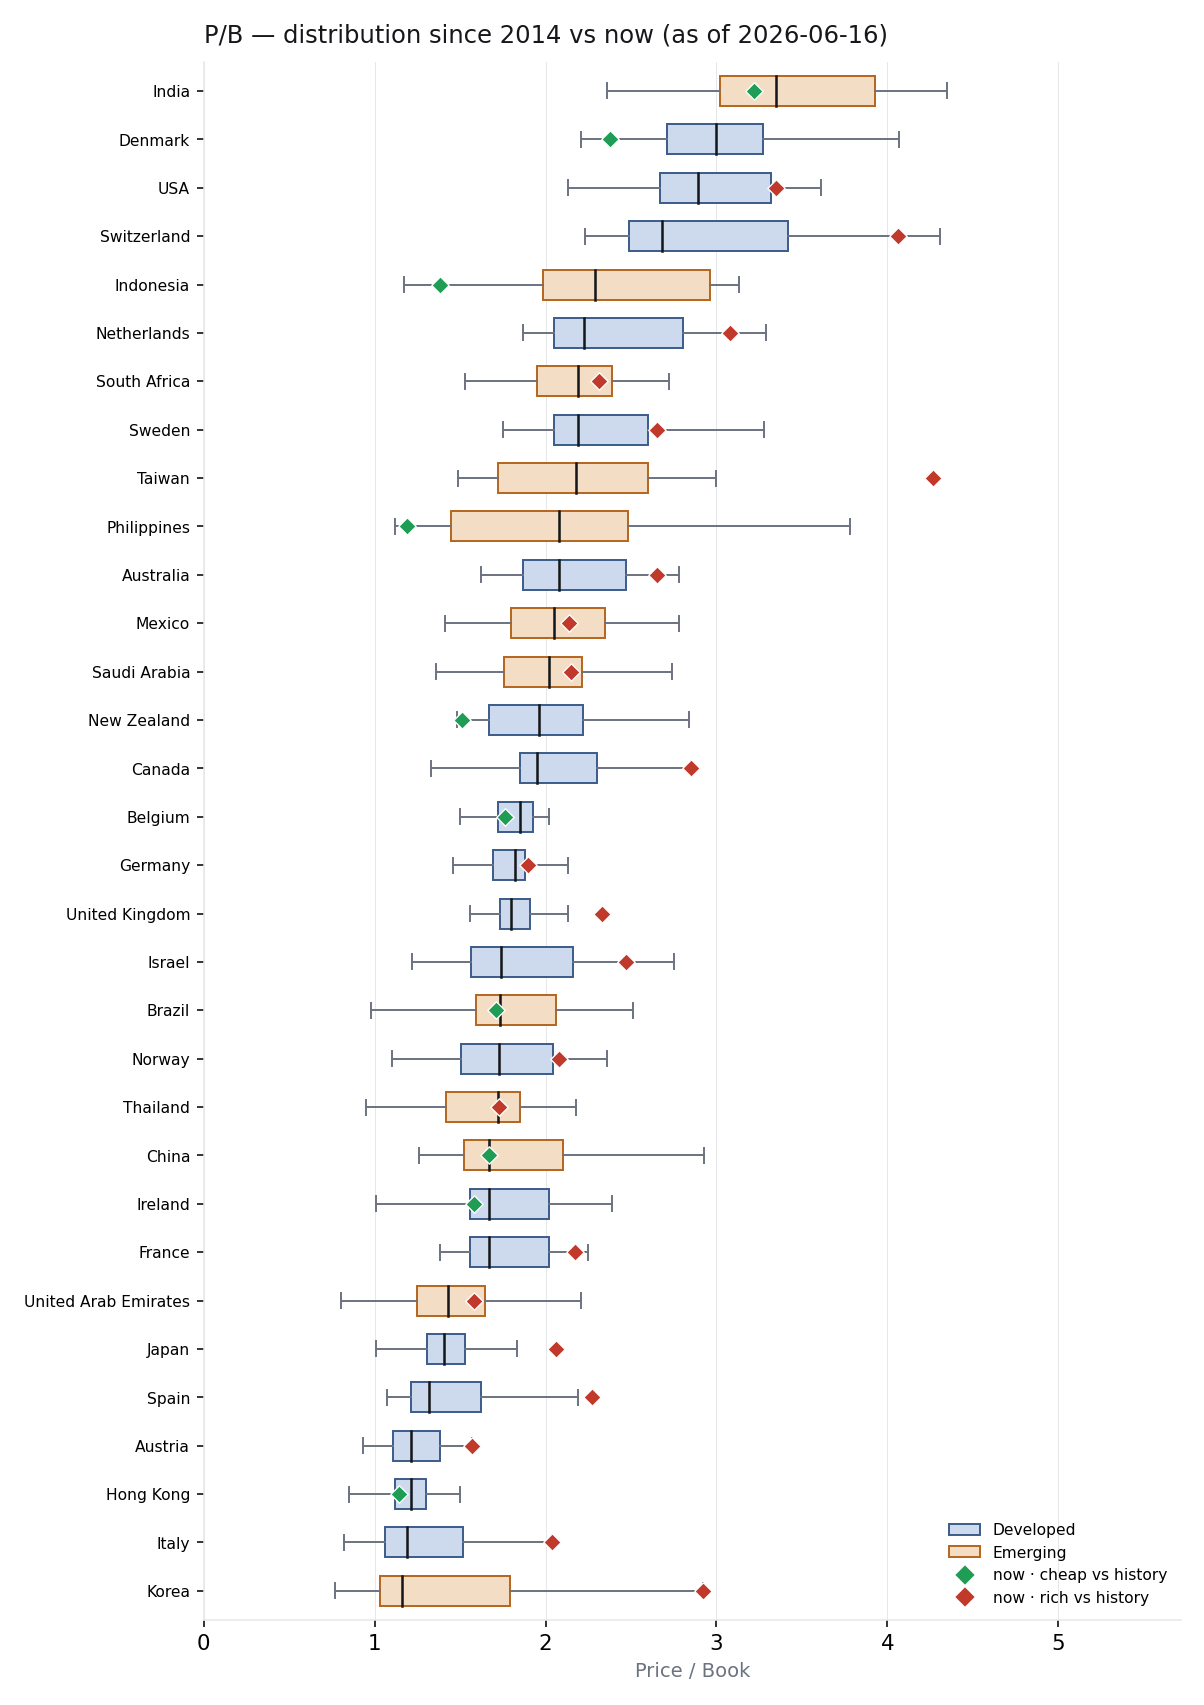
Valuation — P/E & P/B vs own history
iShares single-country MSCI ETF as a proxy for each index. Each box is that market's monthly P/E (or P/B) distribution since 2014 — box = interquartile range, line = median, whiskers = range. The diamond is today's value: green = cheap versus its own history, red = rich. Curated to the larger, well-covered markets.
DM/EM Spread
MSCI World ÷ EM, total return (USD). Up = developed markets stronger, down = emerging markets stronger. Top: the ratio with ±1σ / ±2σ bands; bottom: its 252-day rolling z-score — how stretched the current leadership is versus the past year.