Macro — Risk
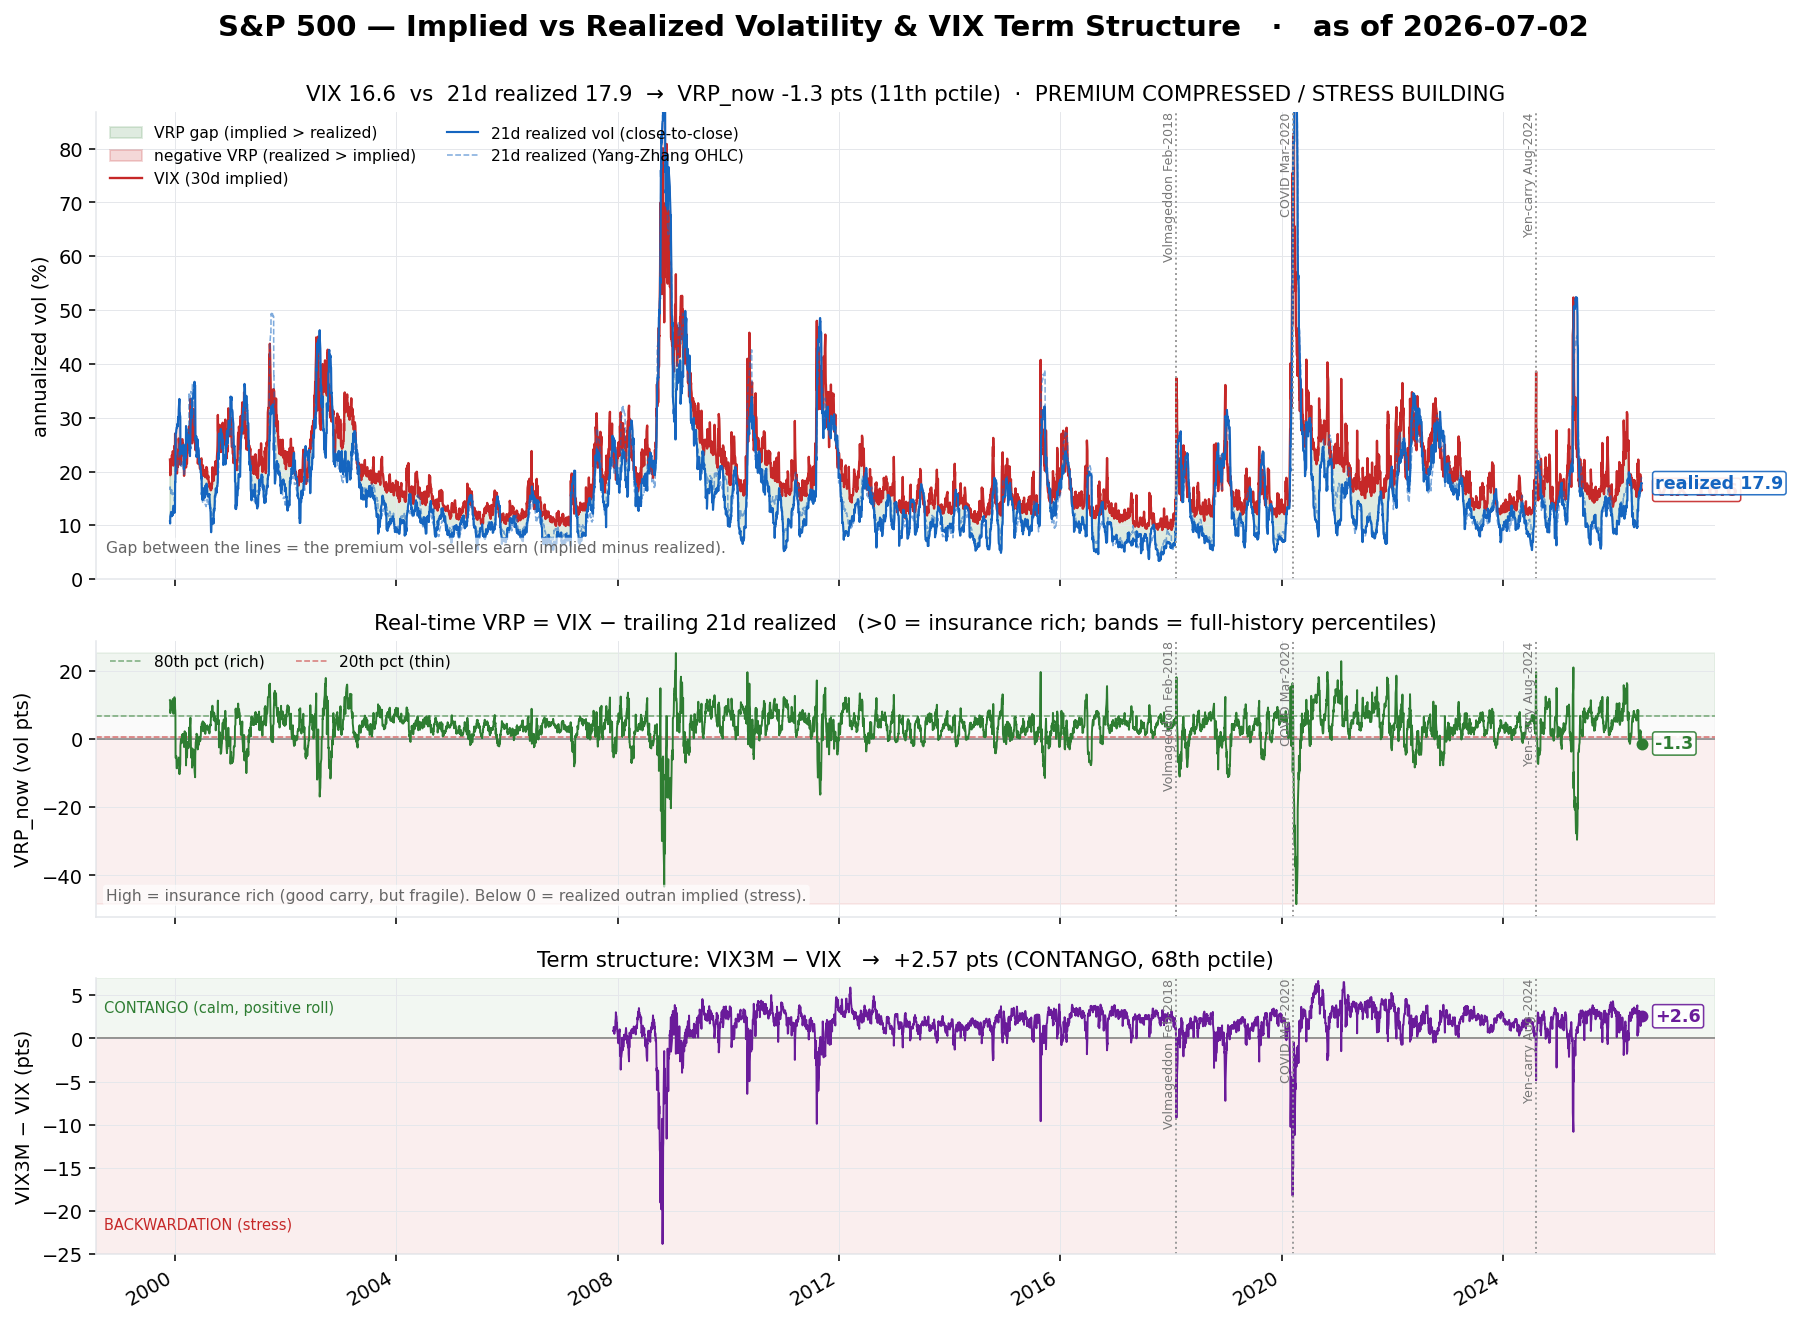
S&P 500 volatility regime — the volatility risk premium (implied minus realized) and the VIX term structure. Implied vol sits above realized ~80–85% of the time: a premium you collect for selling insurance, then give back violently. A calm, high-premium reading is fragile (a coiled spring), not safe — this is a regime gauge, not a buy/sell signal.
As of 2026-07-02 · history 1999-12-01 → 2026-07-02 (6936 days) · click chart to enlarge
VIX 16.6 vs 21d realized 17.9 (YZ 18.9) · VRP -1.3 pts (11th pct) · term structure CONTANGO +2.57 (68th pct) · regime PREMIUM COMPRESSED / STRESS BUILDING
VRP is thin (-1.3 pts, 11th pctile); VIX 16.6. Insurance is cheap relative to recent realized — the cushion for short-vol has eroded. Stress is building or already here; do not fade it mechanically.
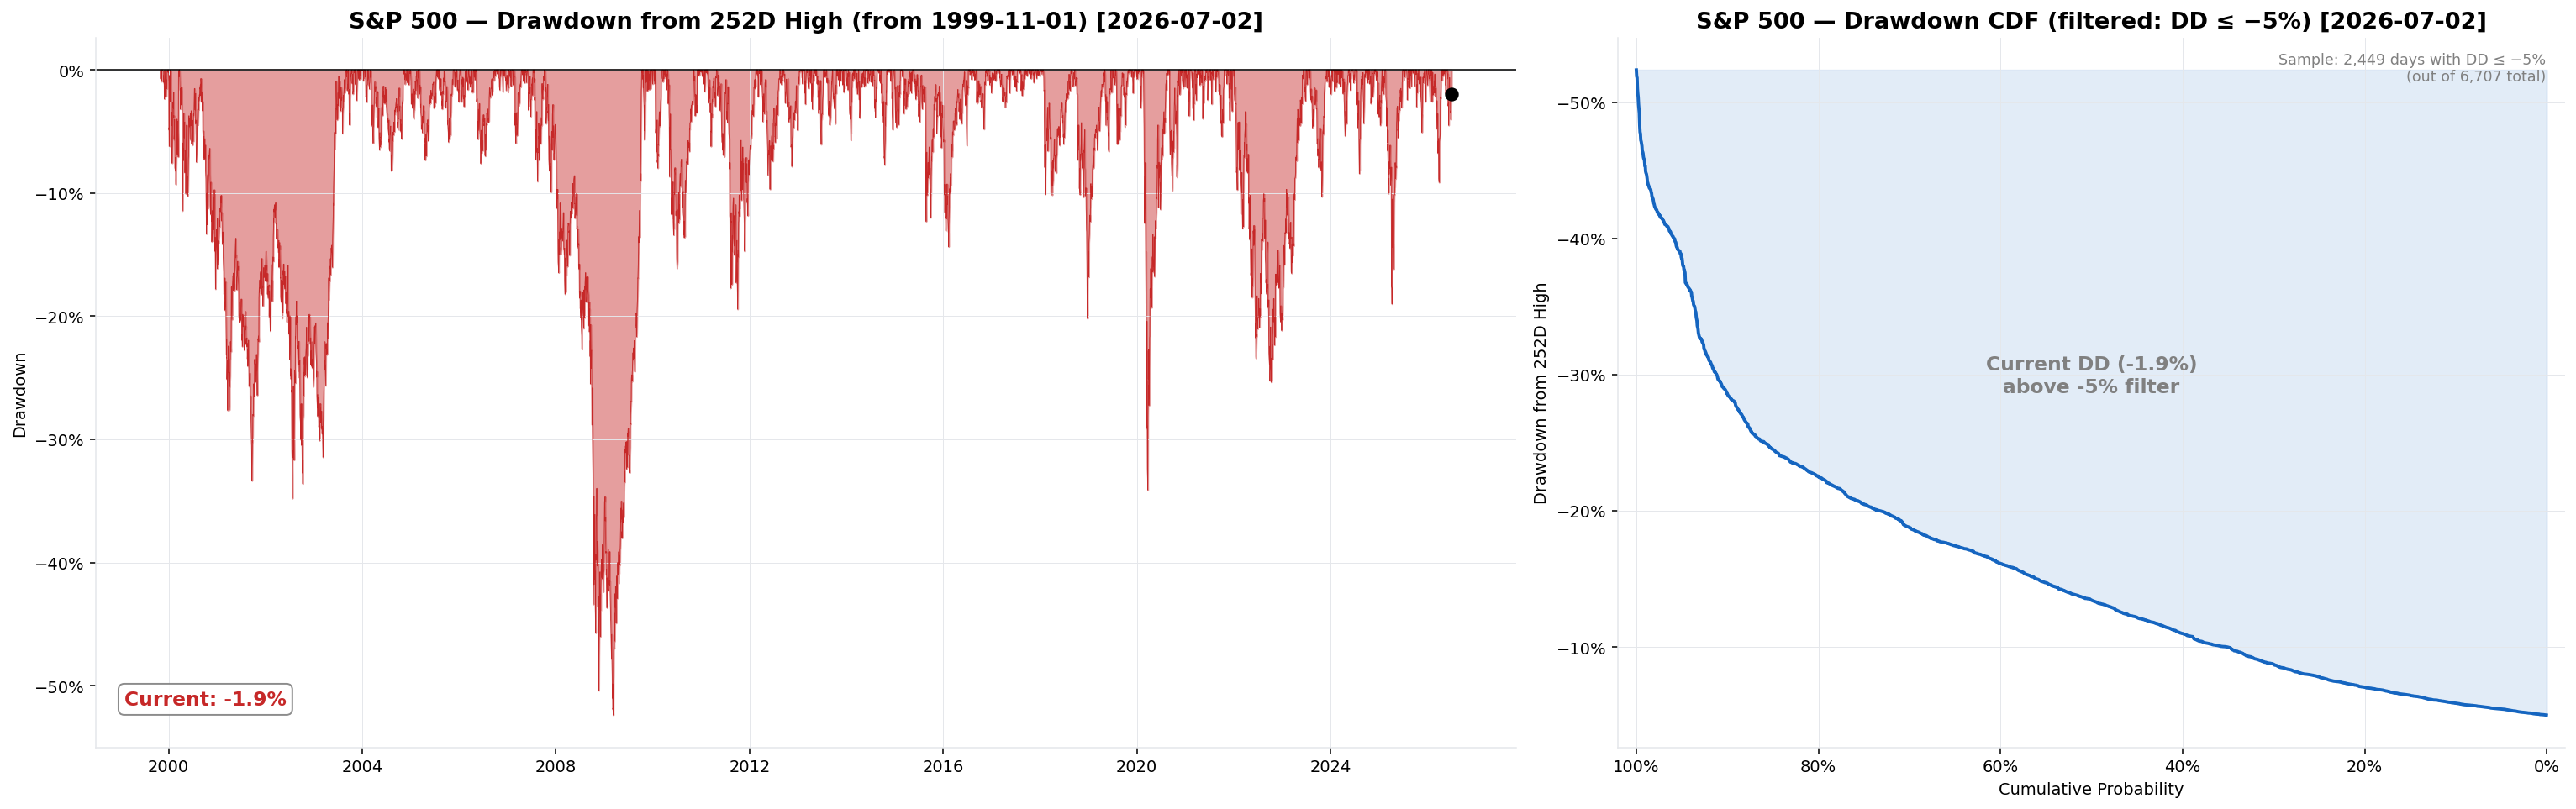
S&P 500 Drawdown
Distance below the trailing 252-day (≈1Y) high · current -1.9% · trailing-1Y trough -9.1%
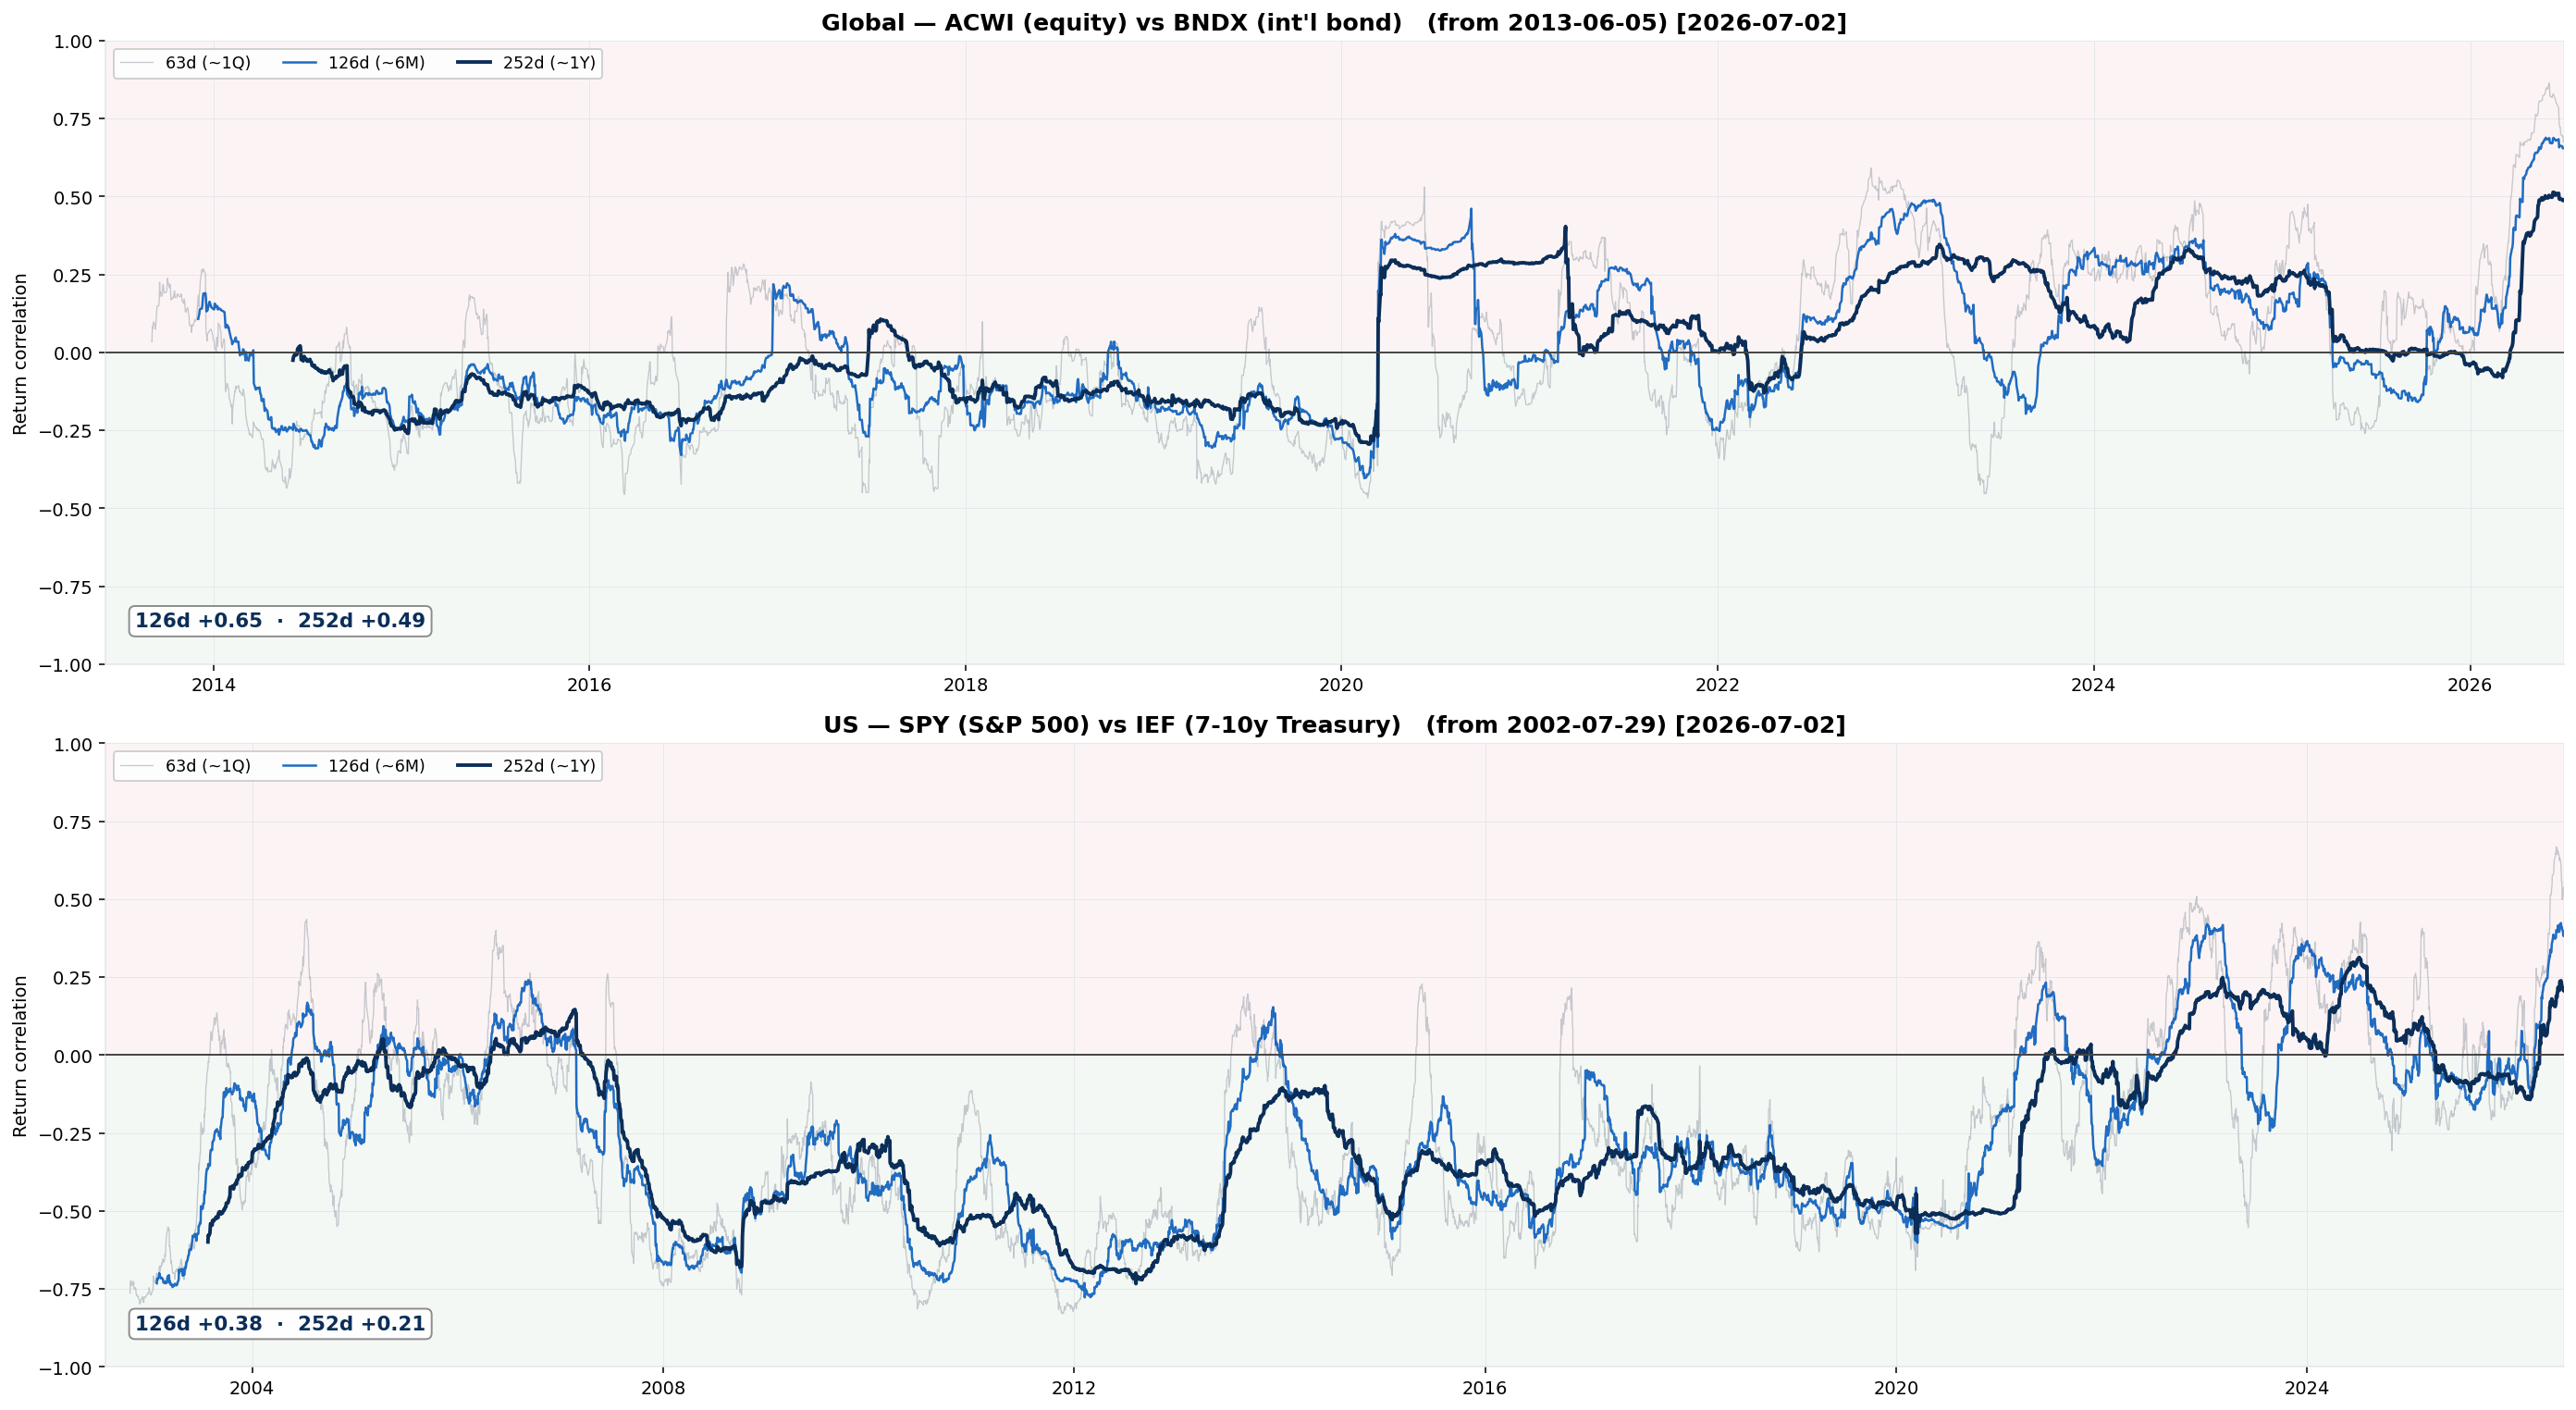
Stock–Bond Rolling Correlation
Rolling correlation of daily total returns — the sign is the diversification regime. Negative = bonds hedge equities (60/40 works); positive = they fall together (the 2022+ inflation regime).
Global ACWI/BNDX: 126d +0.65 · 252d +0.49 · US SPY/IEF: 126d +0.38 · 252d +0.21
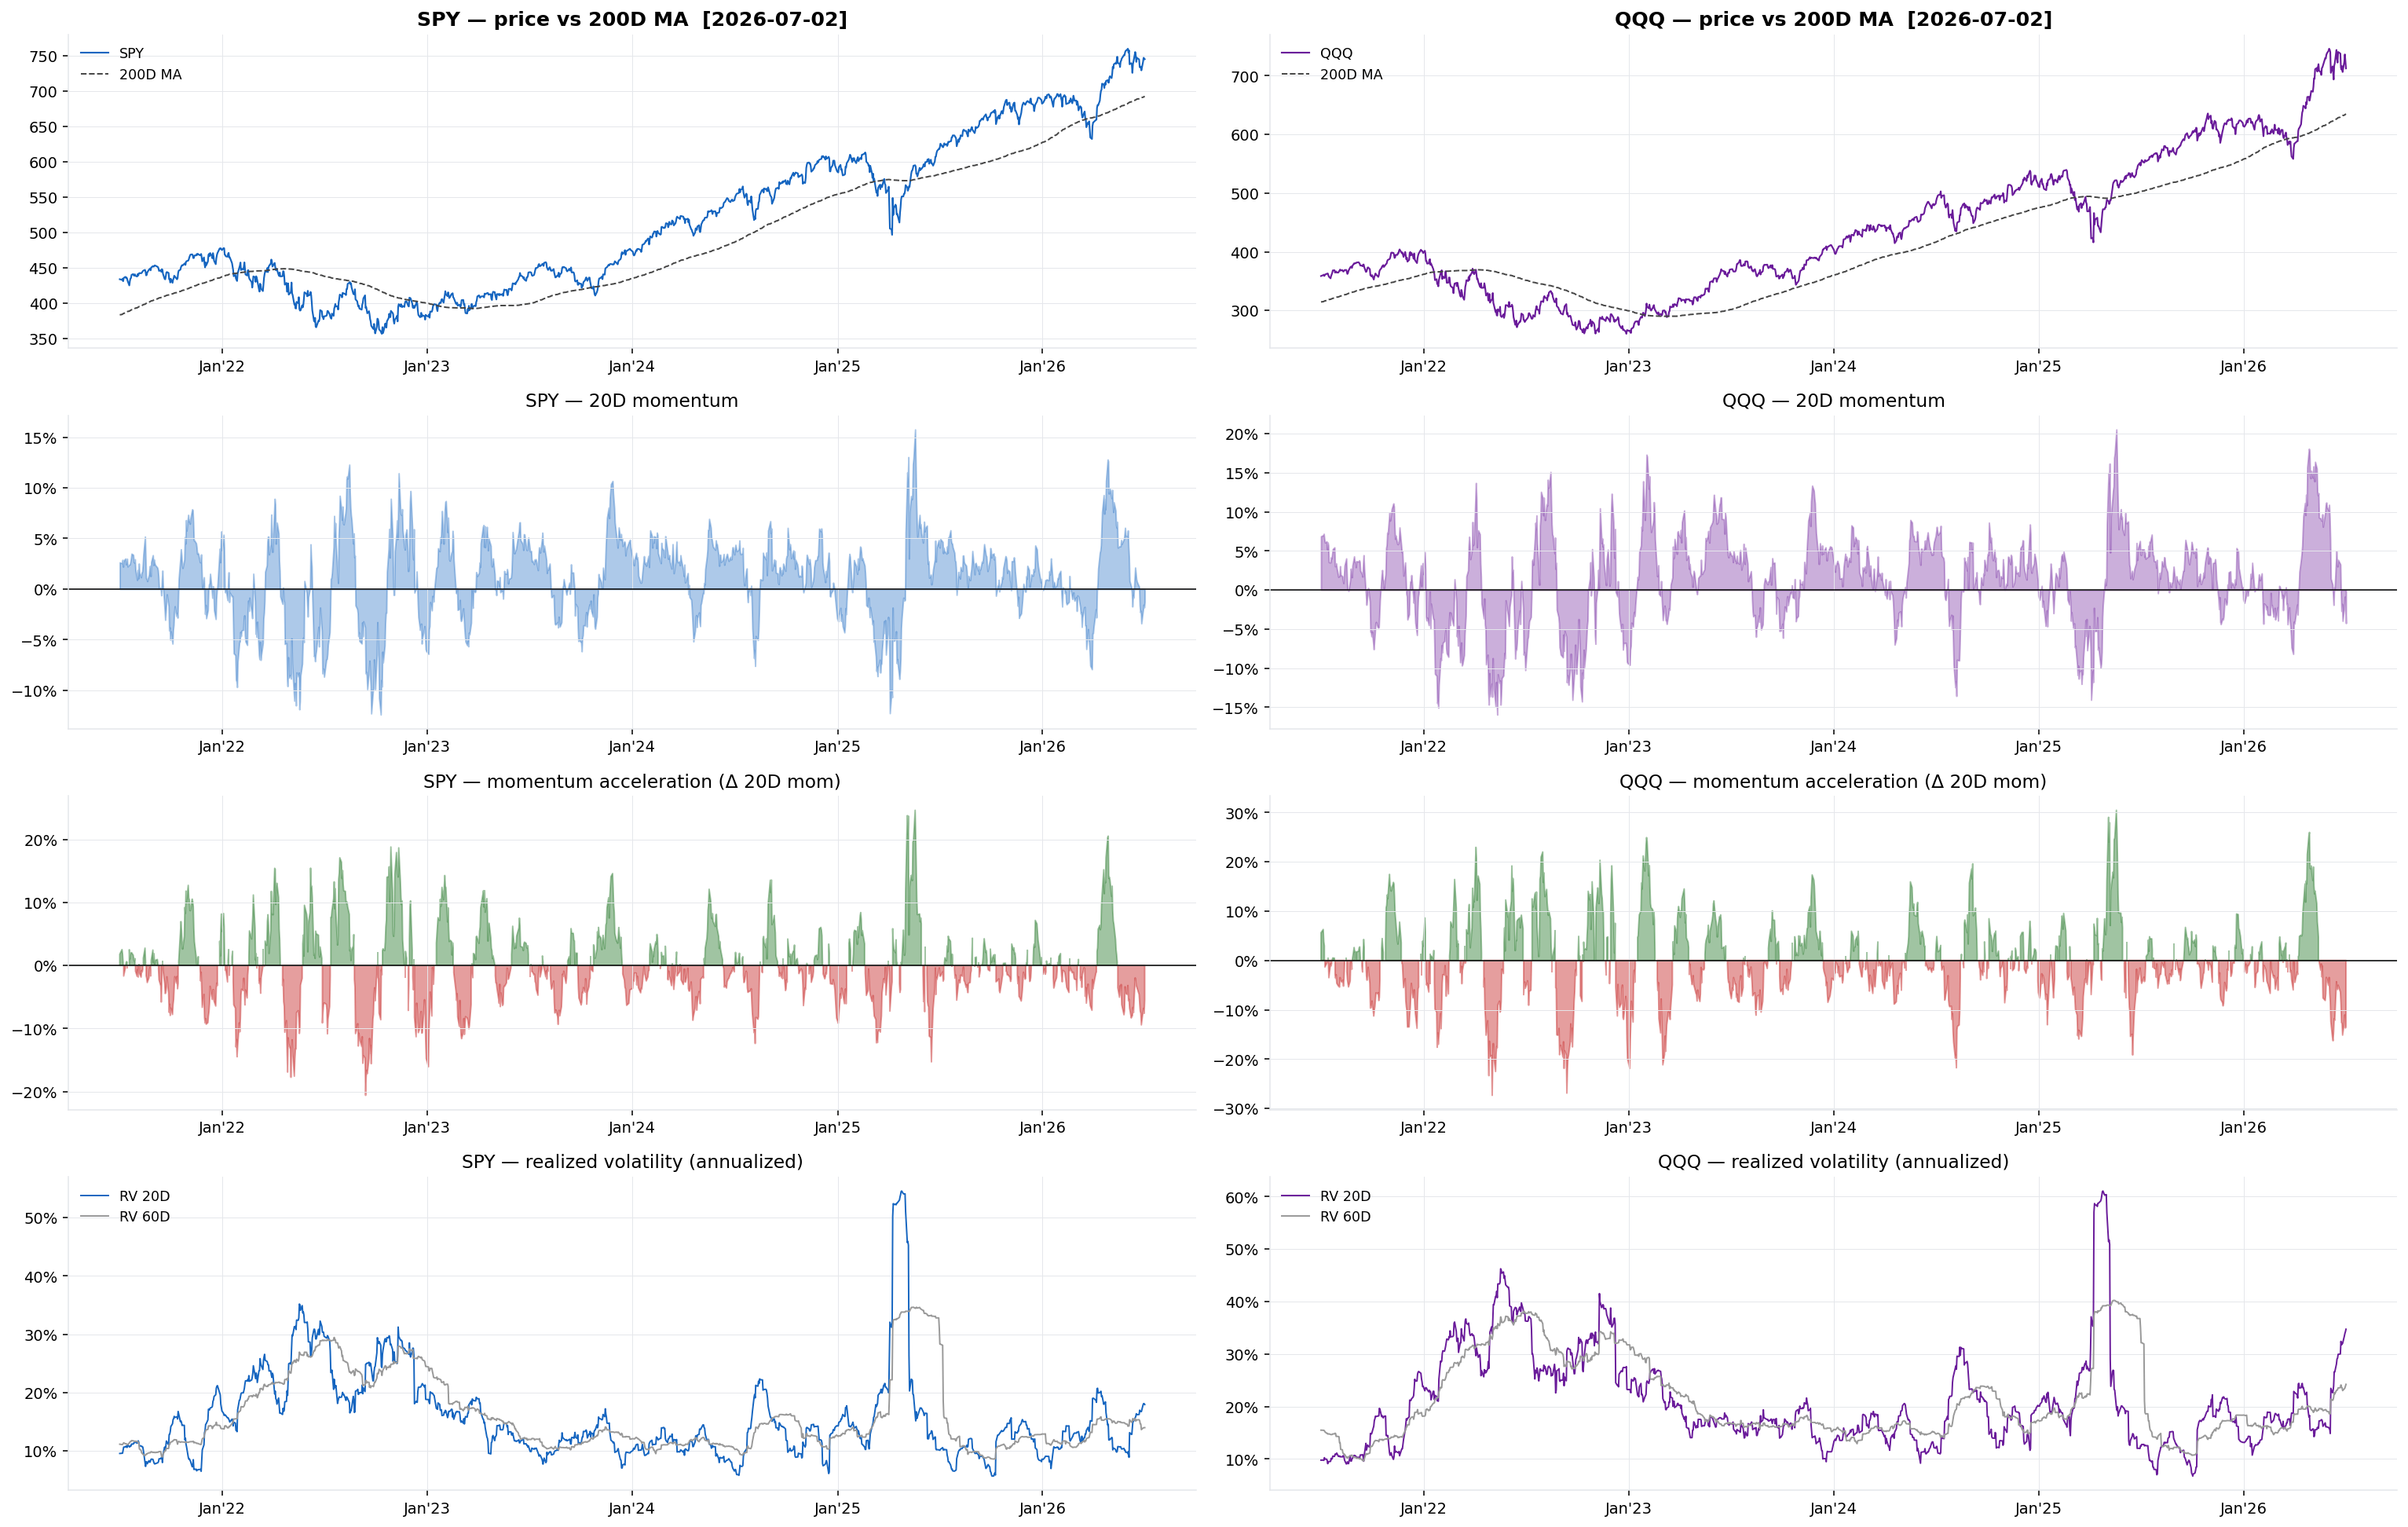
Market-Structure & Crash-Risk Monitor
Trend gives direction, dealer gamma gives persistence vs fade, volatility gives stress, skew gives crash-hedging demand. SPY/QQQ EOD option chains (Alpha Vantage, ~1-day lag) — a descriptive regime gauge, not a signal. Gamma as of 2026-07-02.
Spot is sitting near the zero-gamma flip — the market-structure regime is in transition and can tip from stabilizing to accelerating quickly.
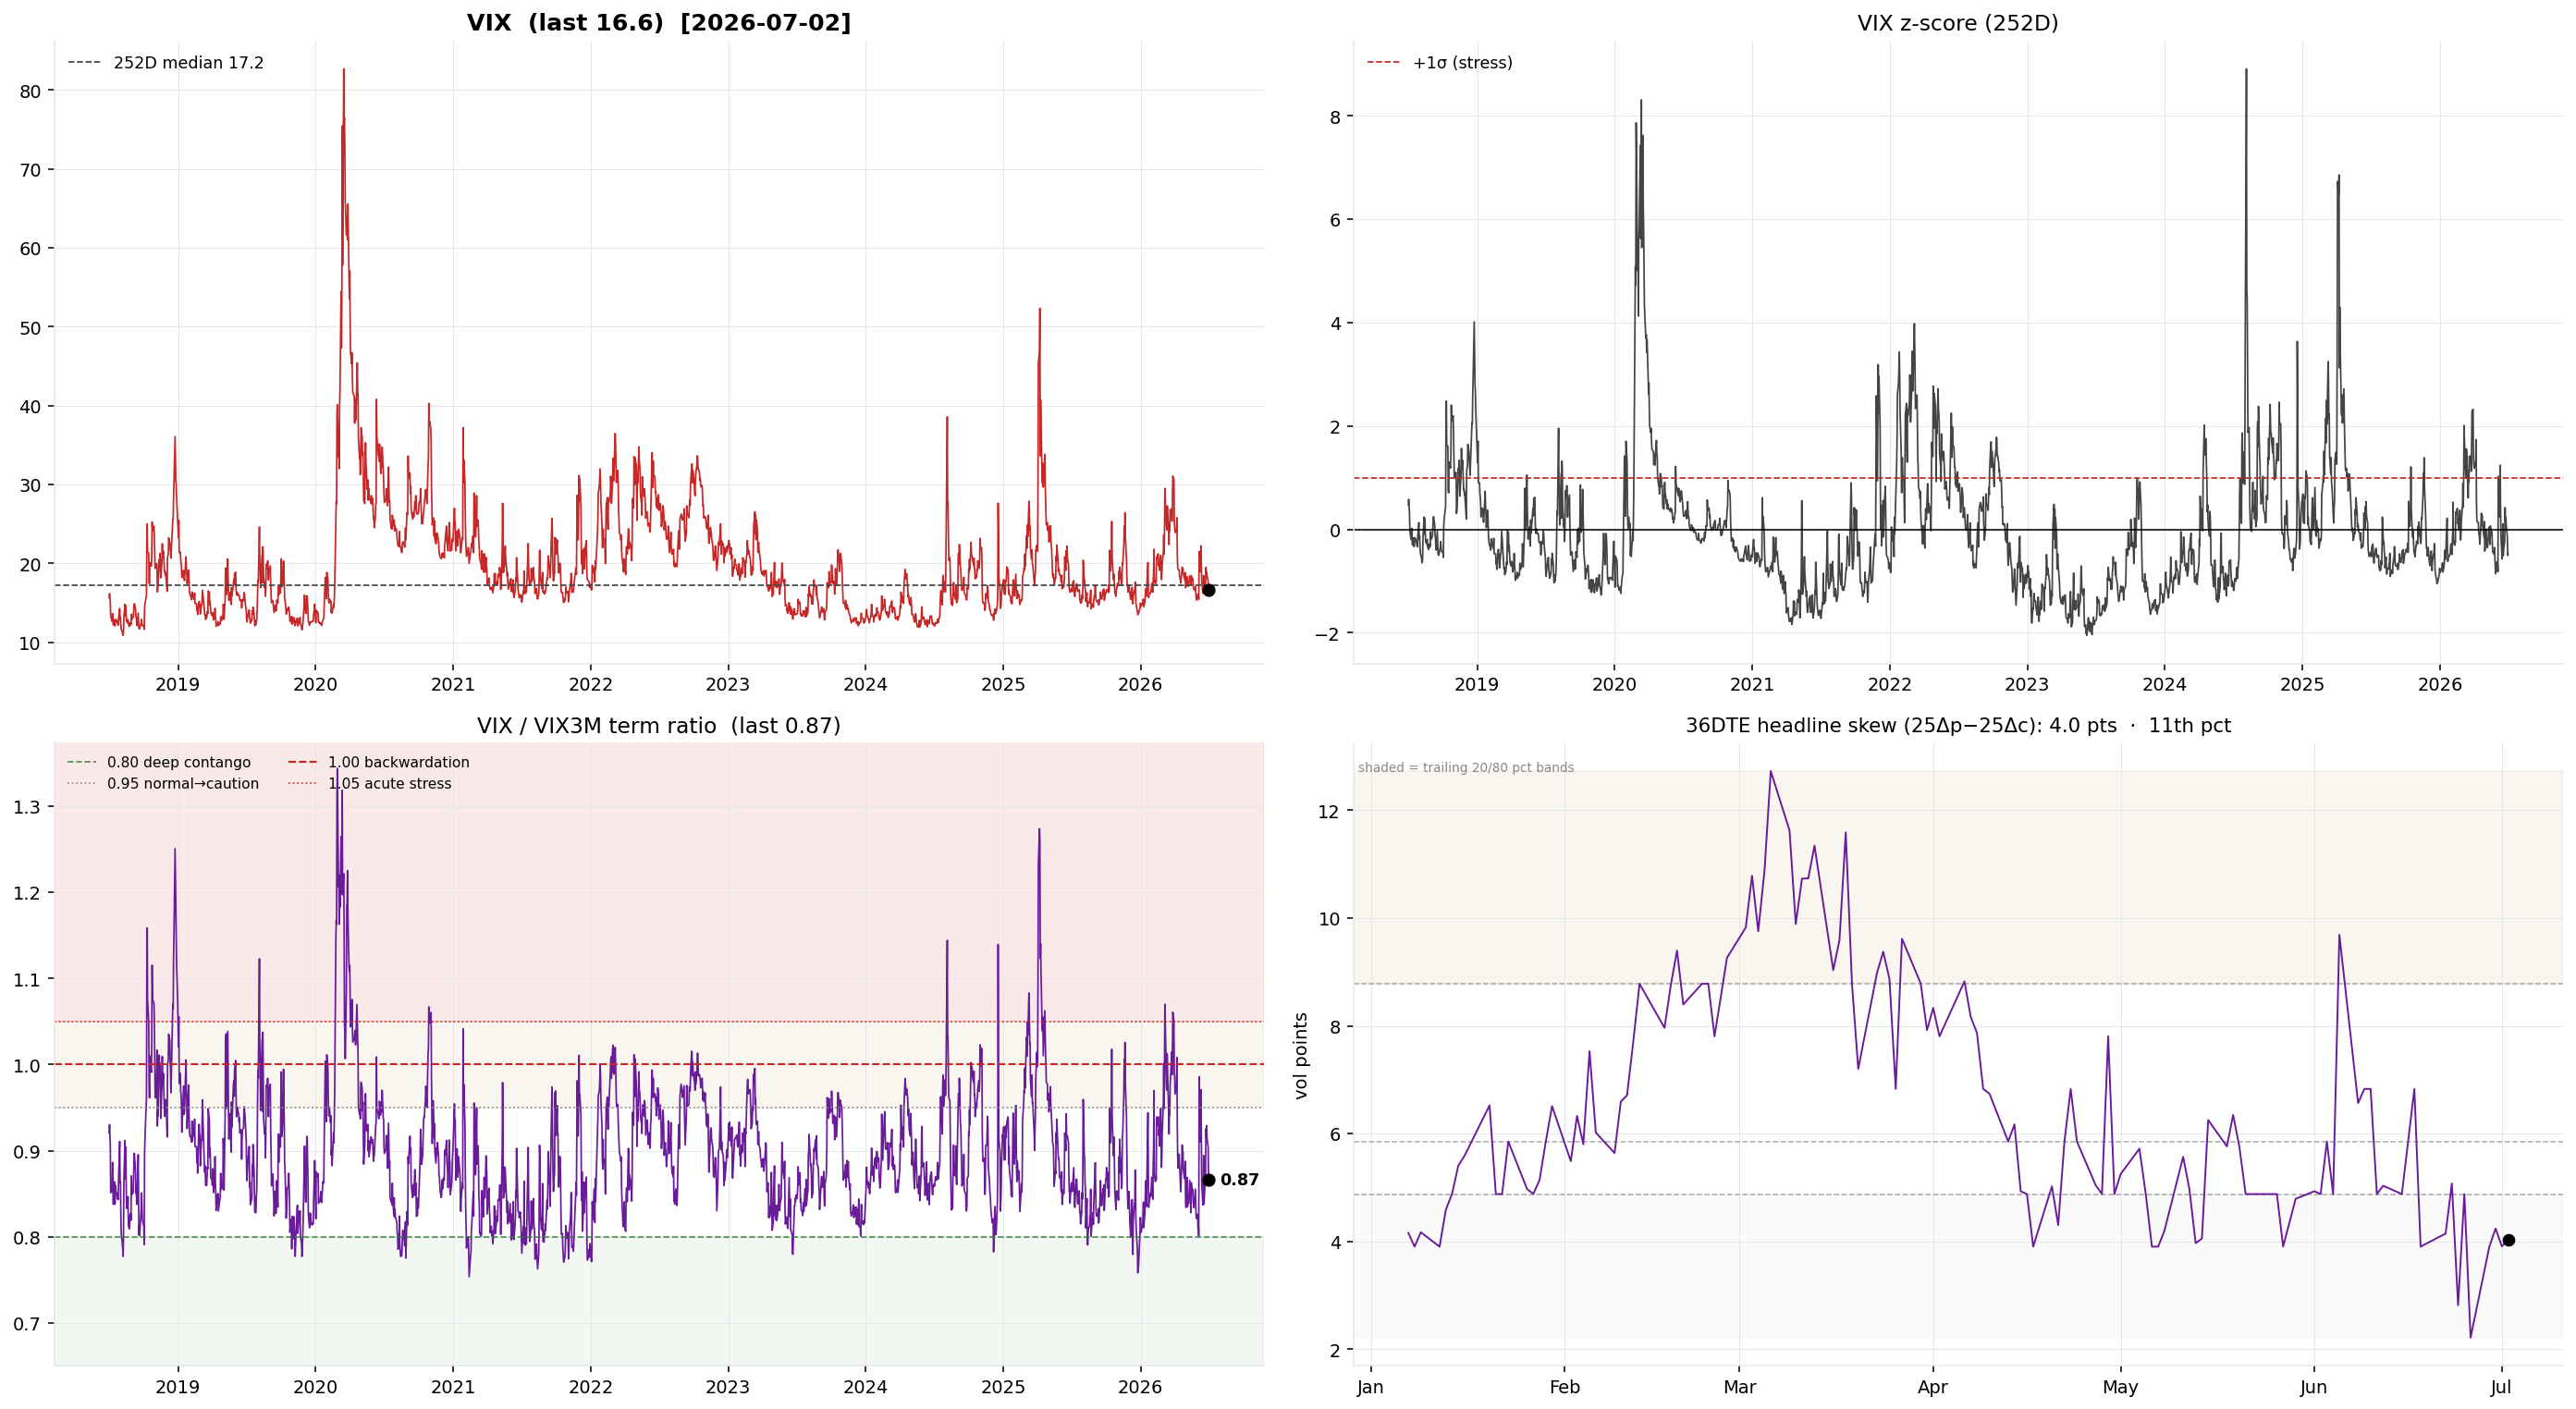
- What it is — four readings of how nervous the options market is, from raw fear (VIX) to the specific price of crash insurance (skew). All forward-looking, priced off live option premiums.
- VIX vs its median — VIX = the S&P move (annualized) that options are pricing for the next 30 days. Above the dashed 252-day median = above-average fear; below = calm.
- VIX z-score — how extreme today's VIX is versus its own past year, in standard deviations. Roughly >+2 = panic spike, <−1 = unusual complacency.
- VIX/VIX3M term ratio — near-term (30d) vs 3-month implied vol. Below 1.0 (contango) is the normal calm state: the market expects today to be quieter than the future. Above 1.0 (backwardation) = acute stress, traders paying up for protection right now. Dashed lines mark the reading bands — see the full guide below.
- 36DTE headline skew (25Δ put − 25Δ call IV) — a constant-maturity read of how much more expensive downside puts are than upside calls, with 20/50/80 percentile bands. Read the change and where it sits in its band, not the raw level — the full signal suite (skew vs price, wing split, skew vs vol) is below.
36DTE Skew Signal Suite
A daily-read skew signal for the S&P 500 (SPY chains as the SPX proxy) — not a one-day snapshot. The implied-vol smile is rebuilt in delta space and pinned to a constant 36-day maturity (interpolated in total variance, killing the expiry-roll sawtooth), then ranked by percentile over a trailing window. Headline skew 4.0 pts (11th pct) · as of 2026-07-02, 120 days
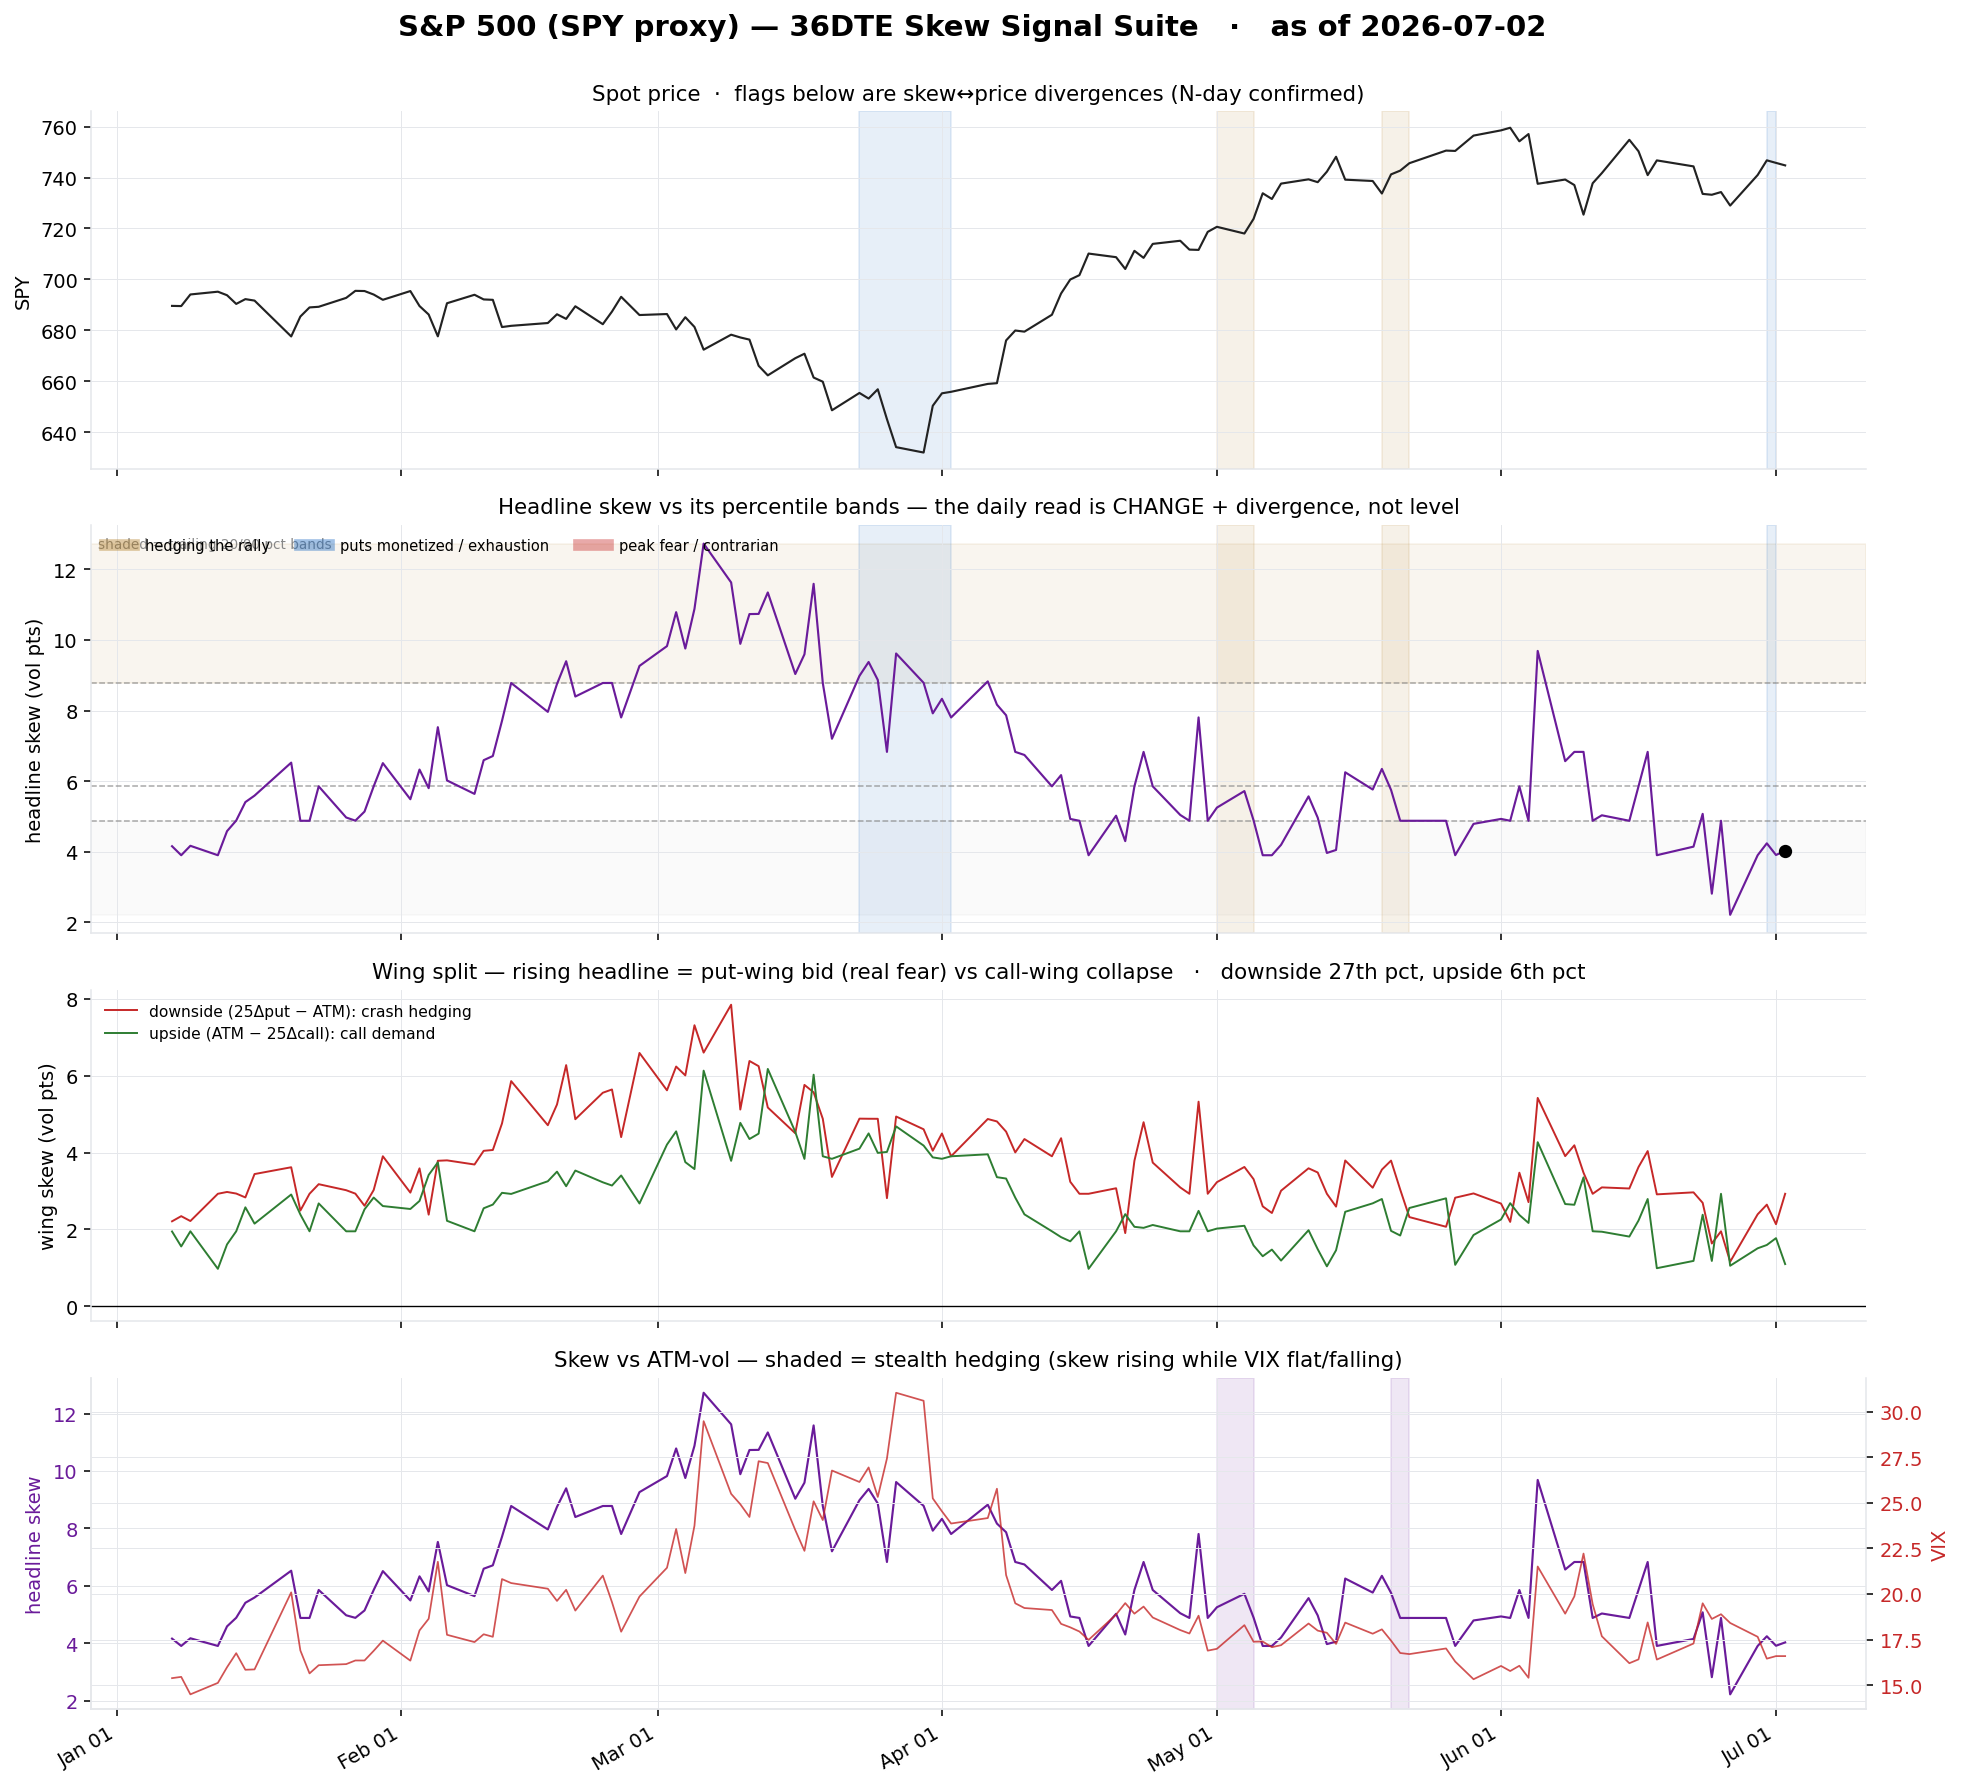
- Why CHANGE, not level — skew level is a weak timing tool: it can stay high for months, and extreme high skew sometimes marks bottoms (everyone has already hedged), not tops. The information is in the change and the divergence from price.
- Spot vs skew (top two panels) — the primary daily read. Three configurations are auto-tagged and shaded when they persist for several days: hedging the rally (skew rising while spot near its highs), puts monetized / exhaustion (skew falling while spot falls), and peak fear / contrarian (skew spiking into a sharp drop).
- Wing split — splits headline skew into the downside wing (25Δ put − ATM = real crash hedging) and the upside wing (ATM − 25Δ call = call demand). A rising headline driven by the put wing is genuine fear; driven by a collapsing call wing it is just no upside demand.
- Skew vs vol — headline skew against VIX. The early-warning configuration is stealth hedging: skew rising while VIX is flat or falling (shaded) — protection being bought before it shows up in headline vol.
- Guardrail — crash-prediction hit rate is modest with frequent false positives. Treat this as one input alongside the VIX term structure above, never a mechanical trigger.
Reading the VIX / VIX3M Term-Structure Ratio
What it measures. VIX is the market's expected vol over the next 30 days; VIX3M (formerly VXV) is the same over 93 days. The ratio divides near-term implied vol by medium-term implied vol.
Contango vs backwardation. Normally uncertainty compounds with time — more can go wrong in 90 days than in 30 — so VIX3M sits above VIX and the ratio runs below 1.0. That's vol contango, the analogue of longer-dated commodity futures trading at a premium to spot; the VIX futures curve leans the same way because short-vol sellers demand a premium for near-term event risk. When a specific near-dated shock lands — a Fed meeting, a geopolitical escalation, an earnings landmine — near-term vol gets bid faster than 3-month vol, the curve inverts, the ratio crosses above 1.0, and you have vol backwardation: the market saying the next 30 days look scarier than the average of the next 90.
- < 0.80 — deep contango, very complacent.
- 0.80 – 0.95 — normal.
- 0.95 – 1.05 — elevated caution.
- > 1.00 — backwardation; historically coincides with meaningful drawdowns / acute vol events.
- sustained > 1.05 — has preceded most bear-market acceleration phases.
Limitations. It's a coincident indicator as much as a leading one — by the time it spikes above 1.0 the move has usually already started. It's also sensitive to options supply/demand: both VIX and VIX3M are variance-weighted, so thinly-traded far-OTM options carry outsized influence and can produce occasional noise spikes that have more to do with the options market than with genuine fear.
Dealer gamma →
The single-day GEX snapshot has moved to a dedicated Dealer Gamma regime suite: distance-to-flip as the headline, daily distance + net-GEX percentile history, near/front/back expiry decomposition, persistent-vs-transient wall detection, and a realized-vol trust check that says whether fragile days actually move more in each symbol's own history.