Country — EM
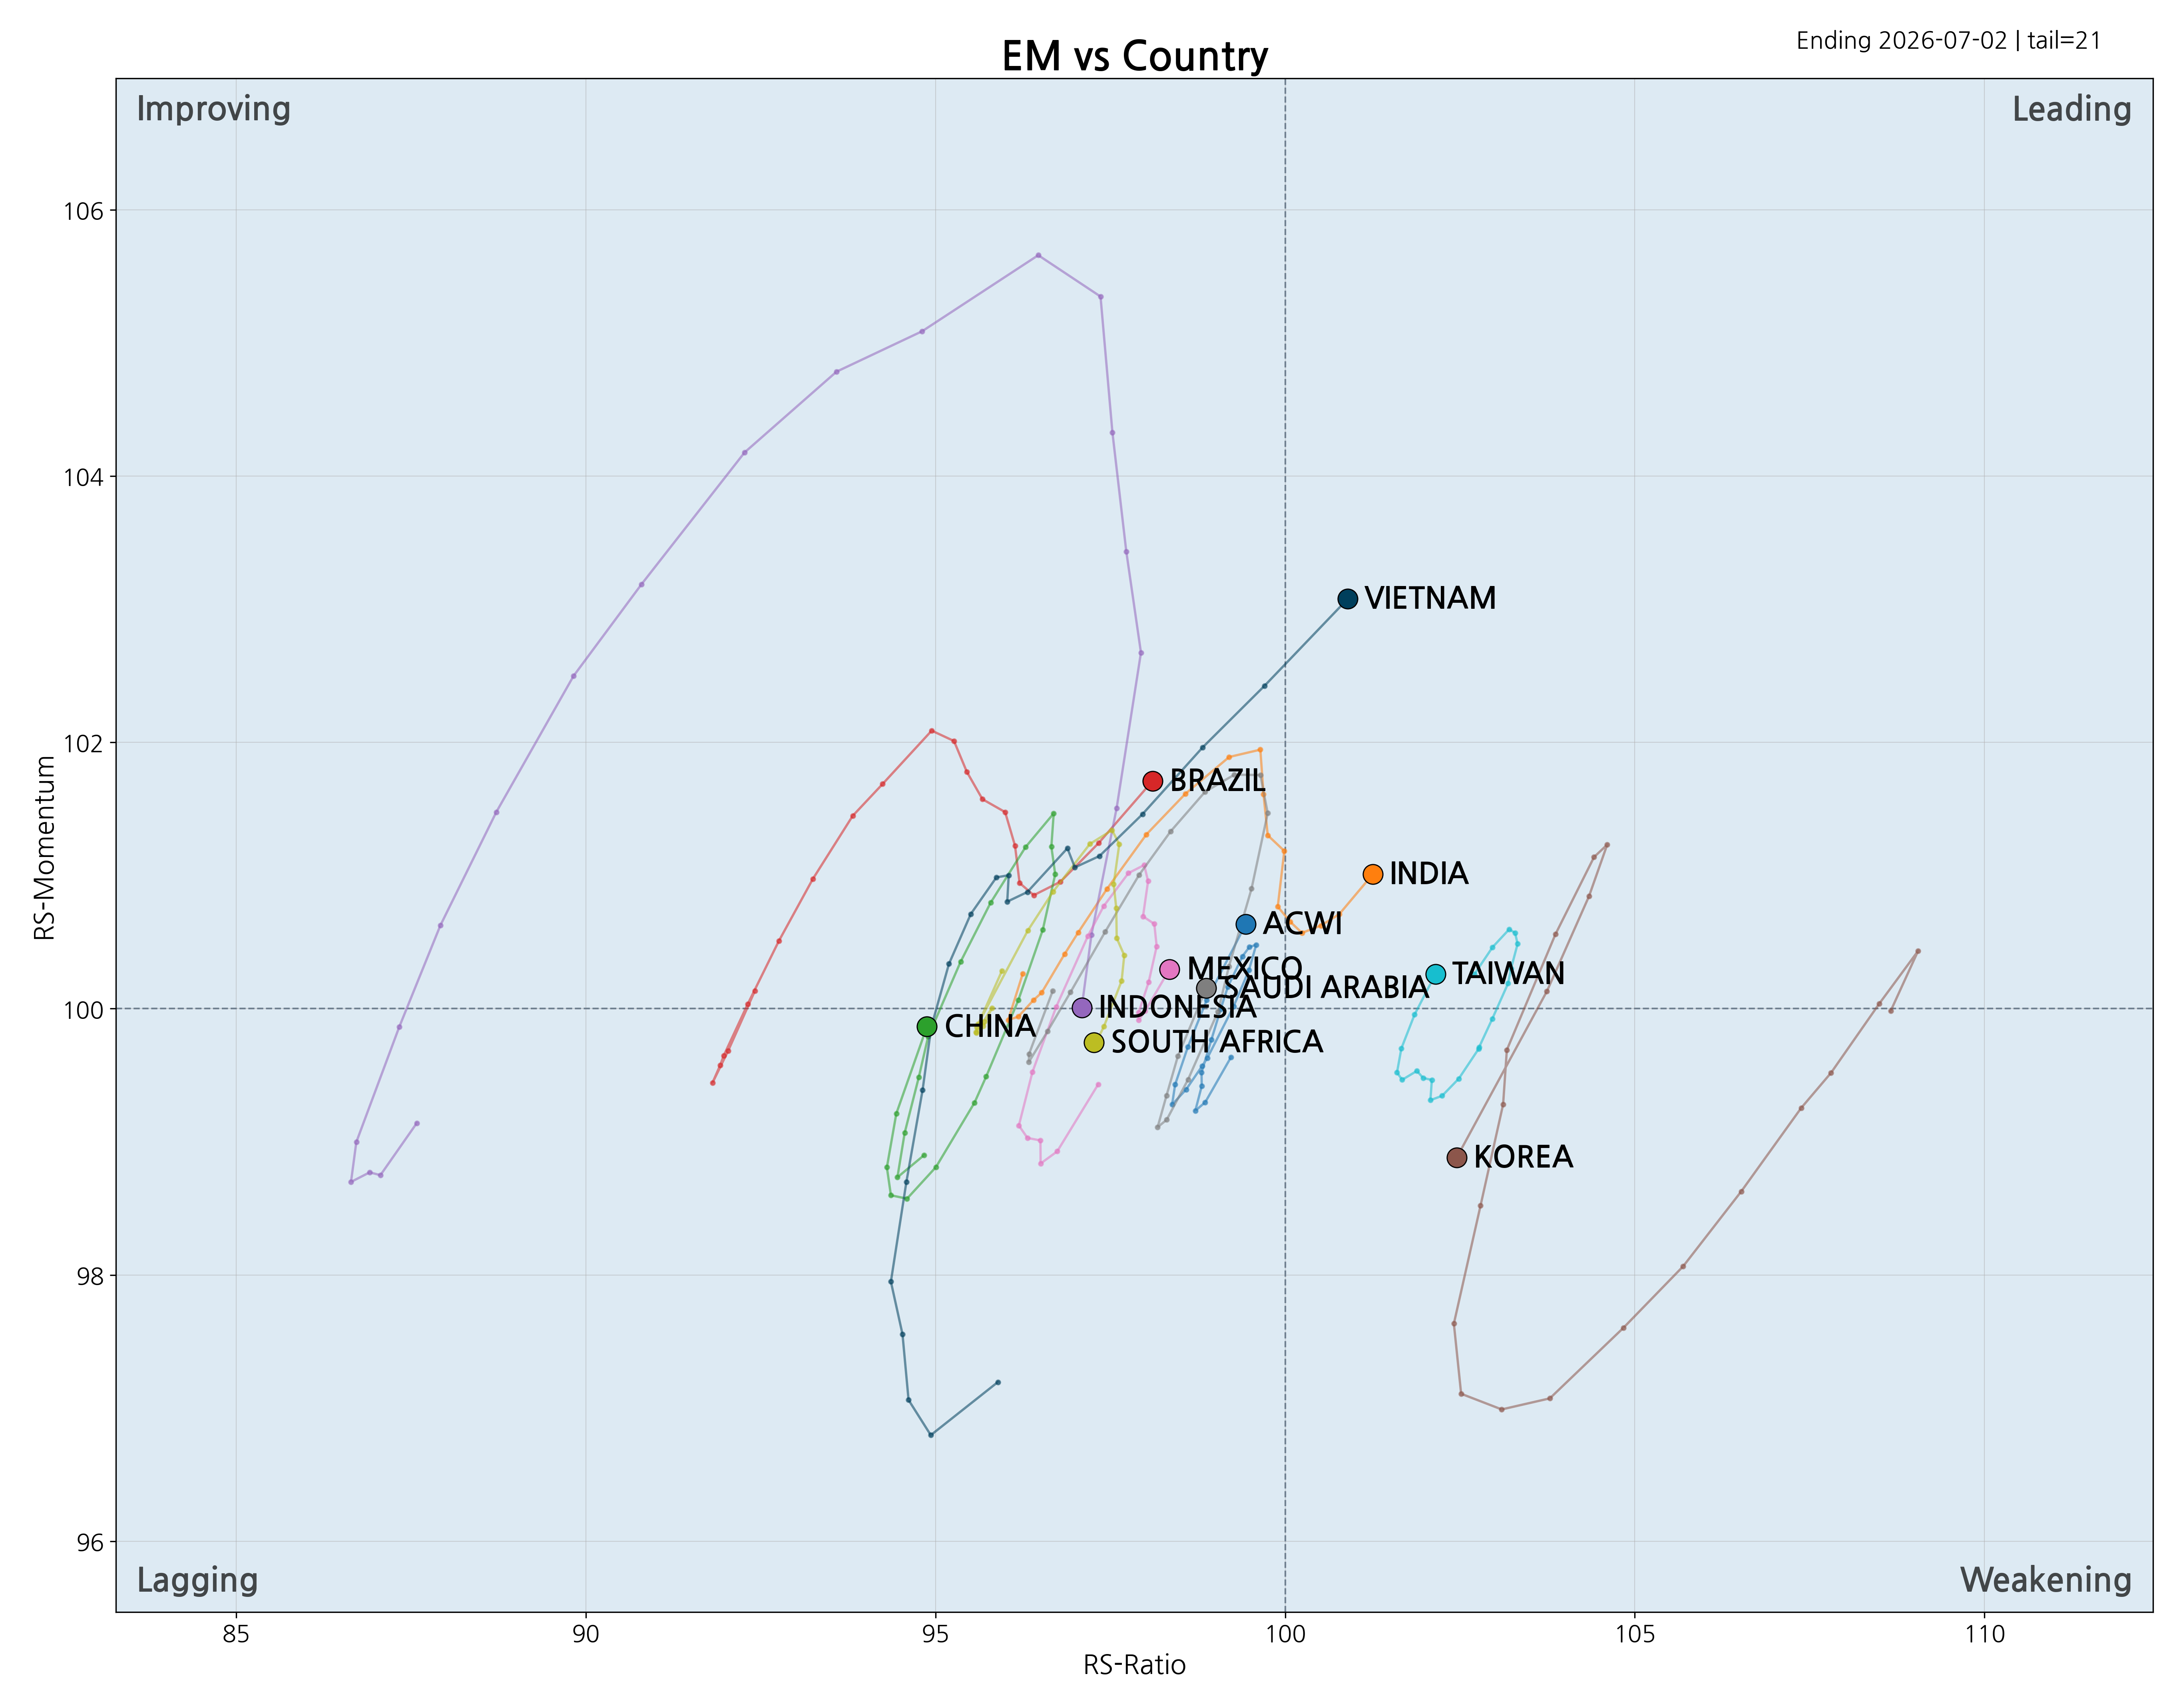
Emerging-market country rotation. RRG shows each country ETF's momentum and relative strength vs the MSCI EM benchmark; the cumulative-return panel, technical-indicator table, and RRG-vs-ACWI screen below track the four flagship single-country / broad-EM funds (MCHI, INDA, IEMG, EWY).
RRG source updated 2026-07-03 07:41 KST · click image to view full size
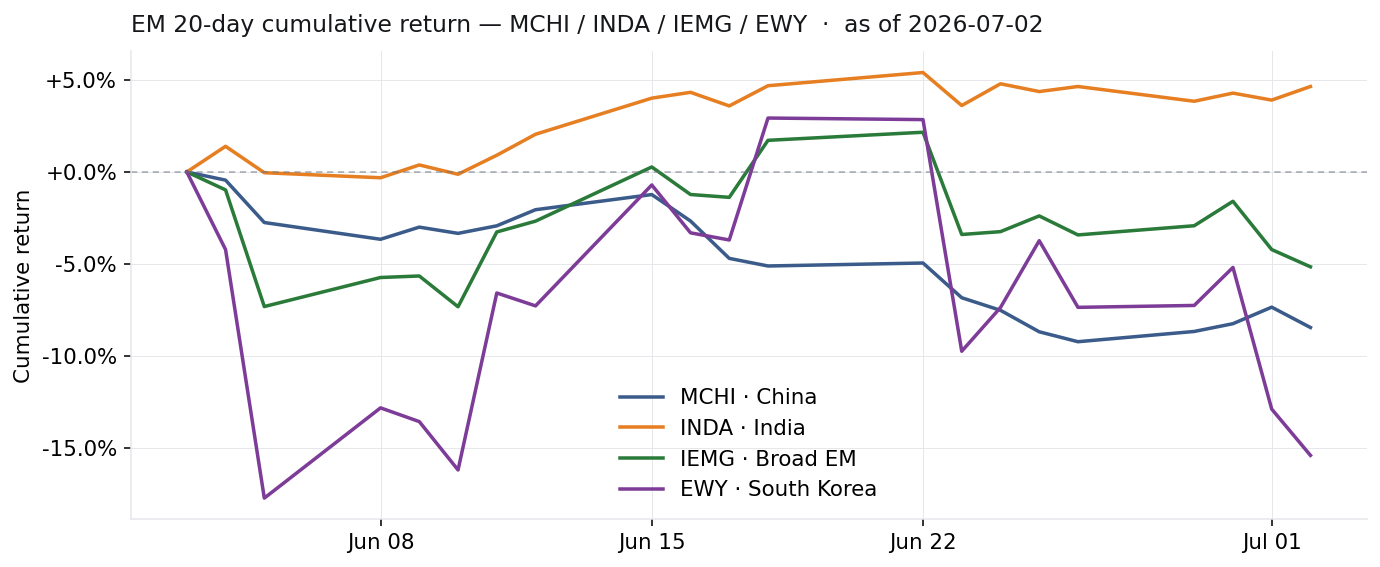
20-day cumulative return — MCHI / INDA / IEMG / EWY
Chart source updated 2026-07-03 08:00 KST · adjusted closes via Alpha Vantage, normalized to t-20 = 0%.
Technical indicators — MCHI / INDA / IEMG / EWY
As of 2026-07-02 · on Alpha Vantage adjusted closes. Bollinger Bands (20, 2σ): %B is the position within the bands (0 = lower, 100 = upper); BW is band width as % of the mid. RSI(14) Wilder; vs 50/200-DMA = price distance from the moving average; MACD histogram (12/26/9); ATR%(14) = average true range as % of price.
| Ticker | Name | Close | RSI(14) | BB %B | BB BW | vs 50DMA | vs 200DMA | MACD hist | ATR% | 52W Range |
|---|---|---|---|---|---|---|---|---|---|---|
| MCHI | iShares MSCI China ETF | 50.91 | 33.7 | 19.3 | 11.5% | −7.7% | −14.1% | -0.097 | 1.68% | 3% |
| INDA | iShares MSCI India ETF | 49.56 | 56.5 | 71.6 | 7.3% | +1.7% | −3.6% | 0.055 | 1.12% | 40% |
| IEMG | iShares Core MSCI Emerging Markets ETF | 79.84 | 45.0 | 27.8 | 10.5% | −1.2% | +11.3% | -0.417 | 2.64% | 78% |
| EWY | iShares MSCI South Korea ETF | 180.14 | 43.1 | 15.6 | 25.0% | −3.8% | +41.0% | -3.390 | 6.62% | 74% |
Relative rotation (RRG) vs ACWI
As of 2026-07-02. Each EM ETF's relative strength and momentum against the iShares MSCI ACWI ETF (all-country world). Same construction as the US theme-ETF screen. Click any rotation chart to enlarge.
As of 2026-07-02 · benchmark ACWI. RS-Ratio = relative strength vs ACWI; RS-Mom = its momentum. Both centered at 100 → the four quadrants are Leading, Improving, Weakening, Lagging. Click any rotation chart to enlarge.
| Ticker | Name | Quadrant | RS-Ratio | RS-Mom | 5D | 20D | MTD | 200D | YTD | 52W Range | Rotation |
|---|---|---|---|---|---|---|---|---|---|---|---|
| MCHI | iShares MSCI China ETF | Lagging | 95.88 | 99.41 | +0.3% | −8.5% | −0.2% | −19.5% | −14.7% | 3% | |
| INDA | iShares MSCI India ETF | Leading | 101.81 | 100.39 | +0.3% | +4.7% | +0.3% | −7.2% | −8.3% | 40% | |
| IEMG | iShares Core MSCI Emerging Markets ETF | Weakening | 100.43 | 99.45 | −2.8% | −5.2% | −3.6% | +25.5% | +19.7% | 78% | |
| EWY | iShares MSCI South Korea ETF | Weakening | 100.75 | 97.81 | −12.1% | −15.4% | −10.8% | +132.7% | +85.3% | 74% |
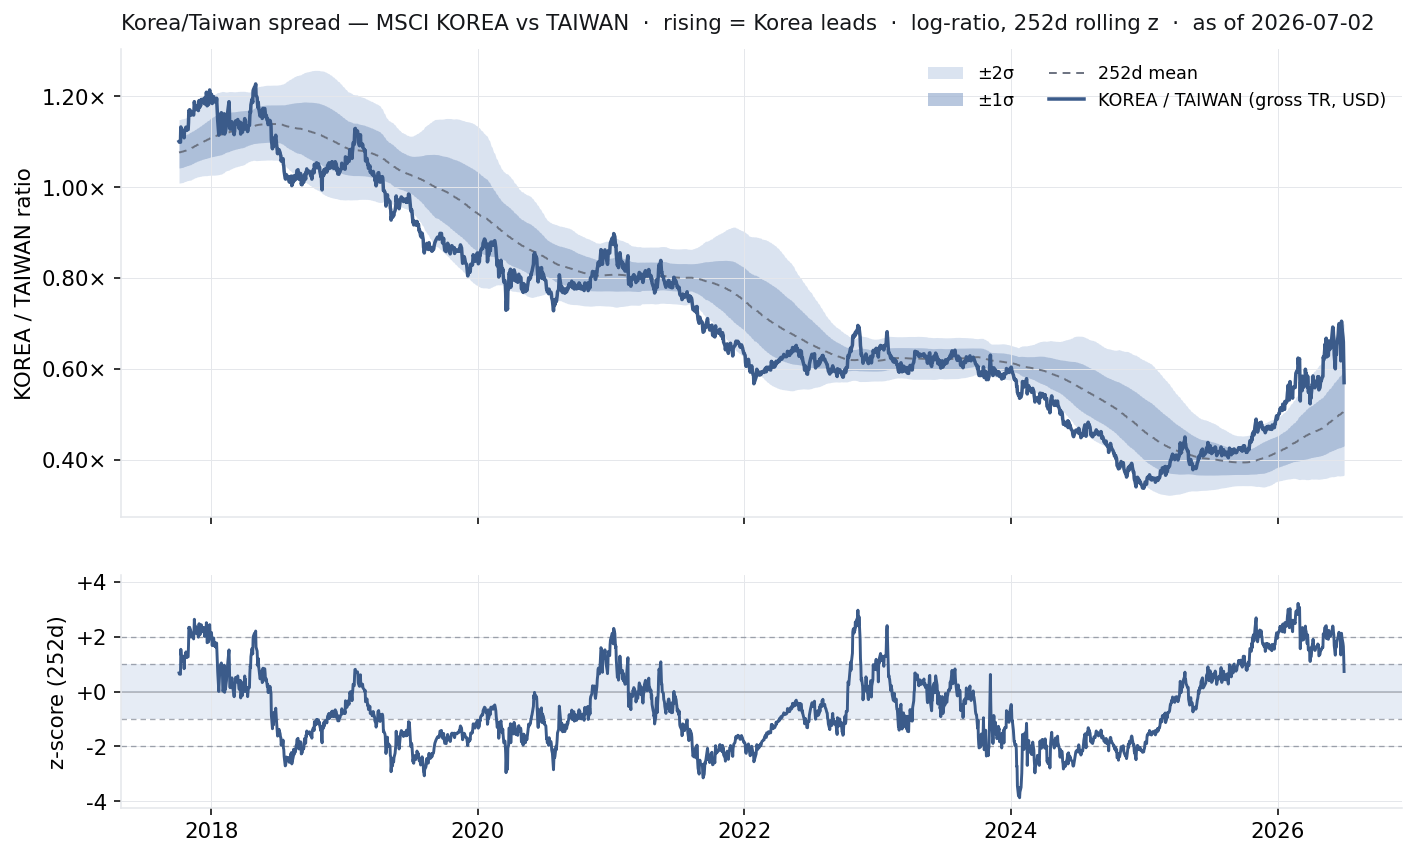
Korea / Taiwan spread
MSCI Korea ÷ Taiwan, total return (USD). Up = Korea stronger, down = Taiwan stronger. Top: the ratio with ±1σ / ±2σ bands; bottom: its 252-day rolling z-score. Updated 2026-07-03 08:00 KST.
Both markets ride the same semiconductor / export cycle, so the spread looks like a pairs trade — but it doesn't mean-revert: a steady Taiwan-over-Korea drift dominates. Read it as a regime lens, not a reversion signal.