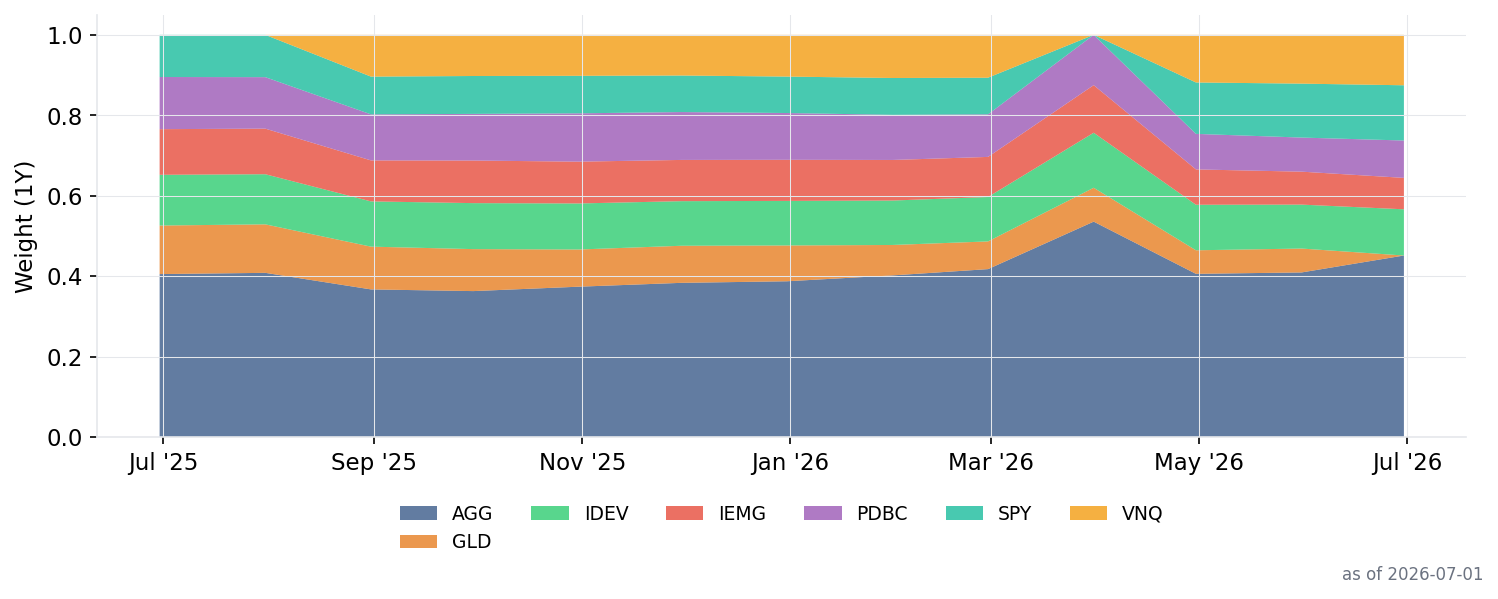
Risk-Parity Trend-Following AA
Current Allocation
| Category | Security | Ticker | Weight | vs prev month-end |
|---|---|---|---|---|
| Bond | iShares Core US Agg Bond | AGG | 45.1% | +4.2%p |
| Cash | Cash (SHY/T-bills) | Cash | 0.0% | 0.0%p |
| Equity | SPDR S&P 500 | SPY | 13.7% | +0.3%p |
| Equity | iShares Core MSCI Intl Developed | IDEV | 11.5% | +0.6%p |
| Equity | iShares Core MSCI Emerging Mkts | IEMG | 7.8% | -0.4%p |
| Real Asset | Vanguard Real Estate | VNQ | 12.5% | +0.4%p |
| Real Asset | Invesco Optimum Yield Commodity | PDBC | 9.3% | +0.8%p |
| Real Asset | SPDR Gold Shares | GLD | 0.0% | -5.9%p |
Weight change vs previous month-end rebalance (2026-05-31).
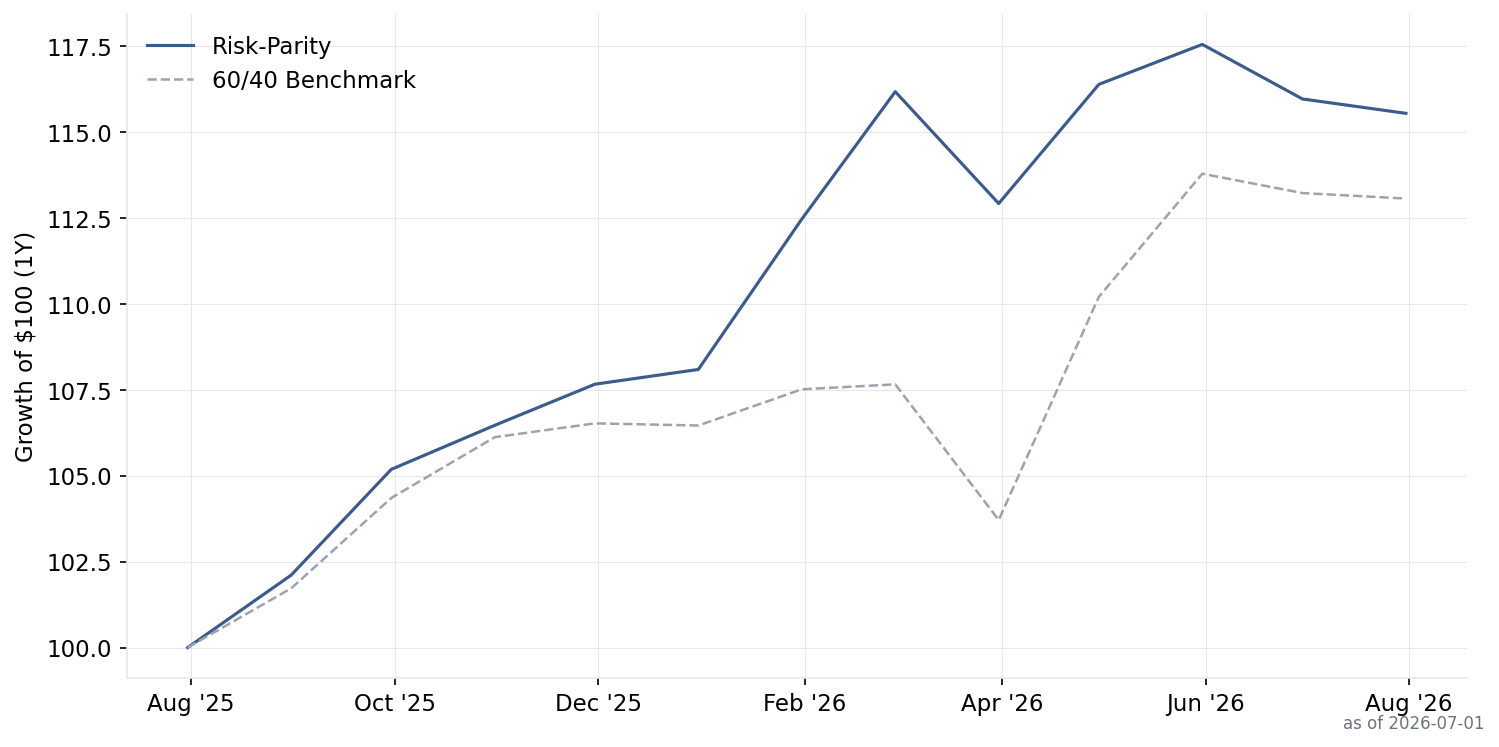
Performance vs 60/40
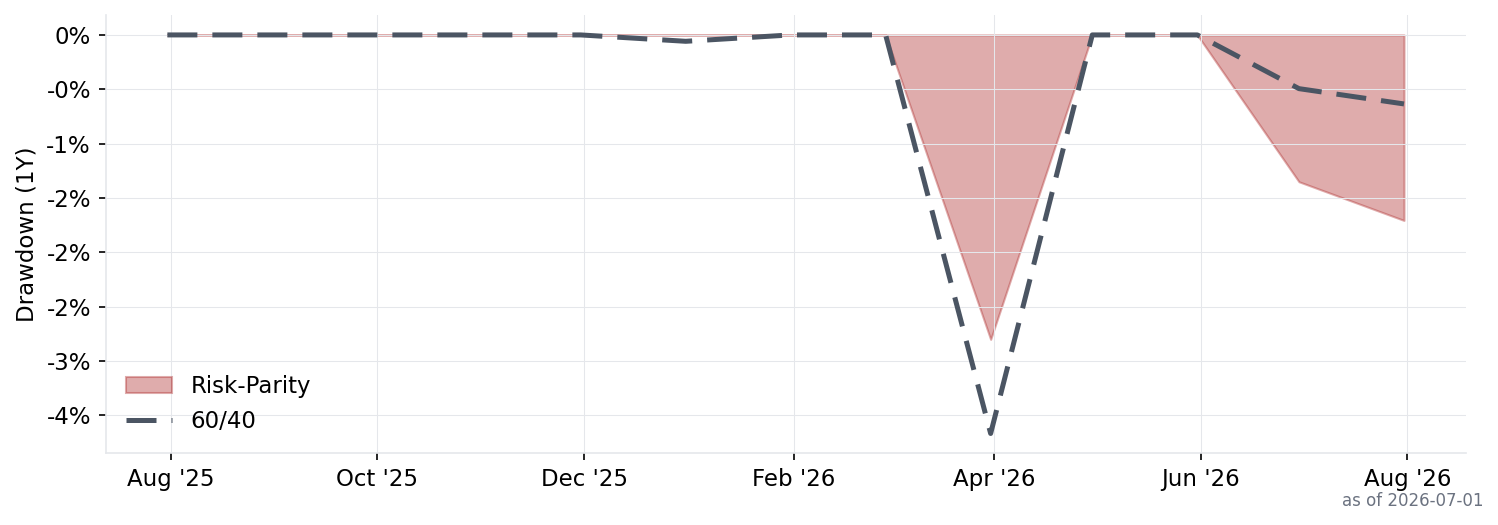
Drawdown
Allocation History
Latest month-end signals
Signals are evaluated once a month at month-end; they do not update intraday.
| Asset | Security | Price | SMA10M | Vol252 | Trend | Signal Date |
|---|---|---|---|---|---|---|
| SPY | SPDR S&P 500 | 745.76 | 701.58 | 12.5% | ON | 2026-07-31 |
| IDEV | iShares Core MSCI Intl Developed | 88.61 | 84.88 | 15.0% | ON | 2026-07-31 |
| IEMG | iShares Core MSCI Emerging Mkts | 80.63 | 74.03 | 22.2% | ON | 2026-07-31 |
| AGG | iShares Core US Agg Bond | 98.5 | 98.32 | 3.8% | ON | 2026-07-31 |
| VNQ | Vanguard Real Estate | 96.82 | 91.66 | 13.7% | ON | 2026-07-31 |
| GLD | SPDR Gold Shares | 370.6 | 409.11 | 27.7% | OFF | 2026-07-31 |
| PDBC | Invesco Optimum Yield Commodity | 15.78 | 15.41 | 18.6% | ON | 2026-07-31 |
Strategy Details
Based on Clare, Seaton, Smith & Thomas's 2012 paper "The Trend is Our Friend." Classic risk parity weights assets by inverse volatility so each contributes roughly equal risk to the portfolio. This version adds a trend filter: assets that fall below their 10-month SMA are excluded and their allocation moves to cash. The combination of risk-parity weighting and trend filtering aims to reduce drawdowns during bear markets while maintaining diversified exposure during normal times. Lower-volatility assets (bonds, gold) naturally receive larger allocations.
Asset Universe
- Risk Assets
- SPY (US equity), IDEV (Int'l developed), IEMG (Emerging markets), AGG (US bonds), VNQ (REITs), GLD (Gold), PDBC (Commodities)
- Cash
- SHY (US short-term Treasuries)
Scoring Formula
Weight = (1 / 252-day trailing volatility) — normalized across trend-positive assets only
Decision Rules
- Calculate 252-day (1-year) annualized trailing volatility for each asset
- Trend filter: only include assets with price > 10-month SMA
- Weight trend-positive assets by inverse volatility (equal risk contribution)
- Assets failing the trend filter → allocation goes to cash (SHY)
- If all assets fail trend → 100% cash
Source
Clare, Seaton, Smith & Thomas, 'The Trend is Our Friend: Risk Parity, Momentum and Trend Following in Global Asset Allocation', 2012 — Paper
Caveats
- IEMG data starts 2012-10-24, limiting backtest history.
- PDBC data starts 2014-11-07, limiting backtest history.
- IDEV data starts 2017-03-23, limiting backtest history.
Data: Alpha Vantage (prices), FRED (unemployment). Transaction cost: 5bps/trade. Backtest: 2017-03-31 to 2026-07-01. Generated: 2026-07-02 09:30:55.