Bond — Labor

The US labor market the way a macro desk reads it — trends over single prints, revisions over headlines, weekly claims between the monthly reports.

Updated 2026-07-05 08:36 KST · monthly through 2026-06-01 · claims through 2026-06-27 · JOLTS through 2026-05-01 · source: FRED

Official labor data reliability has declined — falling survey response rates now require a ~two-month average for the precision a single month once gave, and October-2025 household-survey data is missing (government shutdown). This monitor is built around trends and revisions, not single prints.
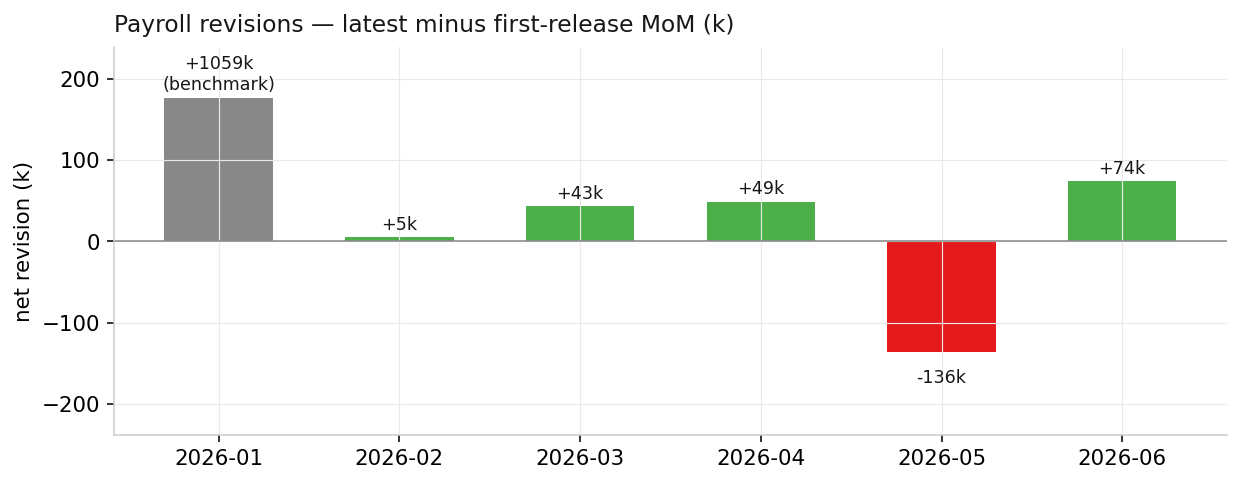
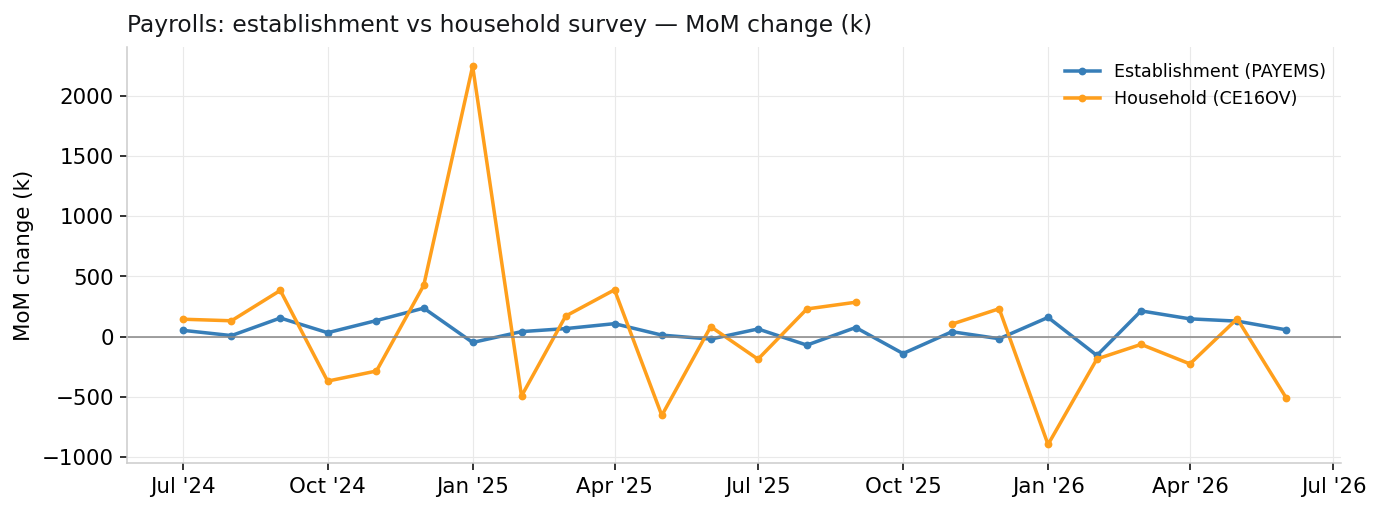
Recession trigger
0.07
current rev. 0.07
Real-time Sahm rule · green <0.30 · amber 0.30–0.49 · red ≥0.50
Payroll trend
+111k/mo
3-mo avg MoM
3-month average of monthly payroll change vs prior 3-month average
Hiring stress
1.81M
continuing claims
Continuing claims, 13-week trend — rising = harder to find work
Core utilization
80.2%
prime-age (25–54) emp-pop
Prime-age employment-population ratio vs 6 months ago — cleanest single gauge
Unemployment
4.2%
U-3 rate
Unemployment rate (U-3) vs 3 months ago

Payrolls

The headline single print is the least reliable element — read the 3-month average and the revisions, not one month.

Latest MoM+57k2026-06-01
3-mo avg+111k/mo
6-mo avg+92k/mo
Private+49k
Government+8k
Temp help+9kleading
Payroll revisions — latest minus first-release MoM
How each month's payroll print was revised (latest − first release). Green = revised up, red = down. January absorbs the BLS annual benchmark and is shown greyed.
Establishment vs household survey payroll change
Establishment (PAYEMS) vs household (CE16OV) employment, MoM change — watch for sign divergence.

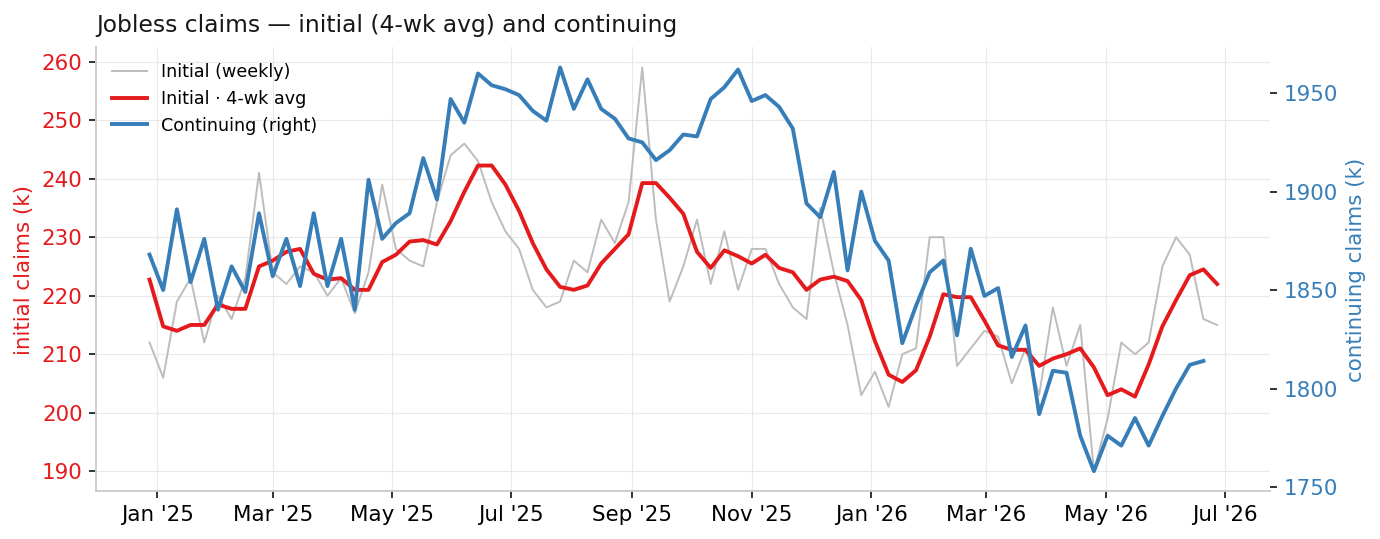
Weekly jobless claims

The highest-frequency hard data — the heartbeat between monthly reports.
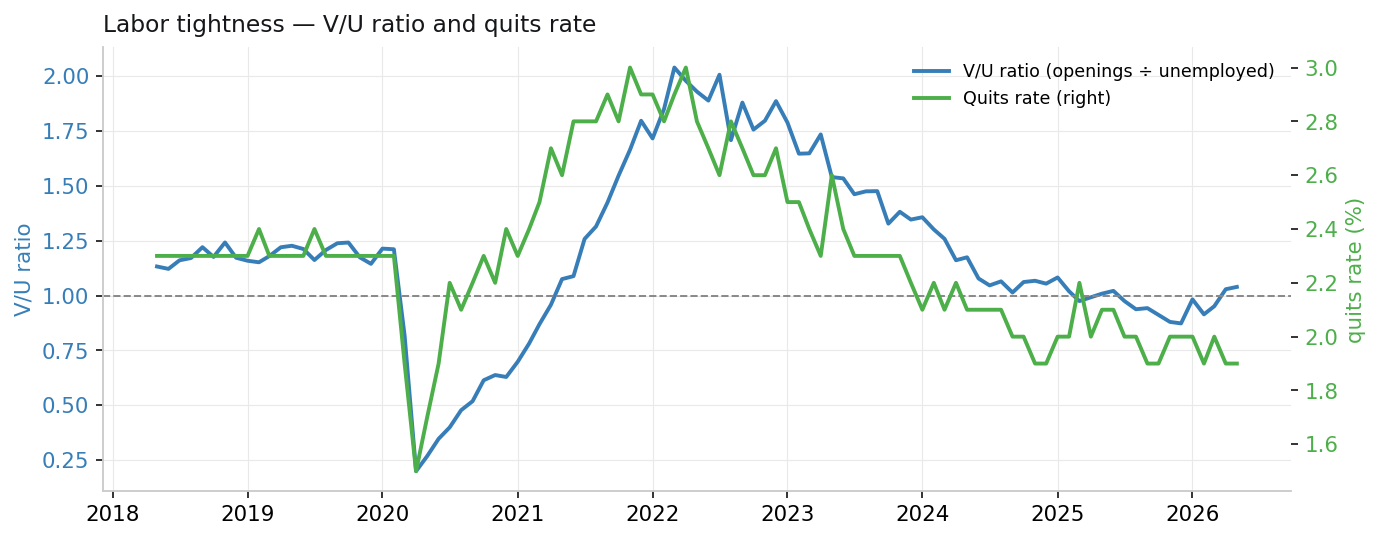
Initial215k-1k WoW
Initial · 4-wk avg222k
Continuing1.81M-18k 13-wk
Initial and continuing jobless claims
Initial claims (weekly + 4-week average) and continuing claims. In a low-hire market, continuing claims matter most.

JOLTS — tightness

The Fed's labor-tightness gauge. JOLTS lags ~2 months (BLS schedule) — latest is 2026-05-01.
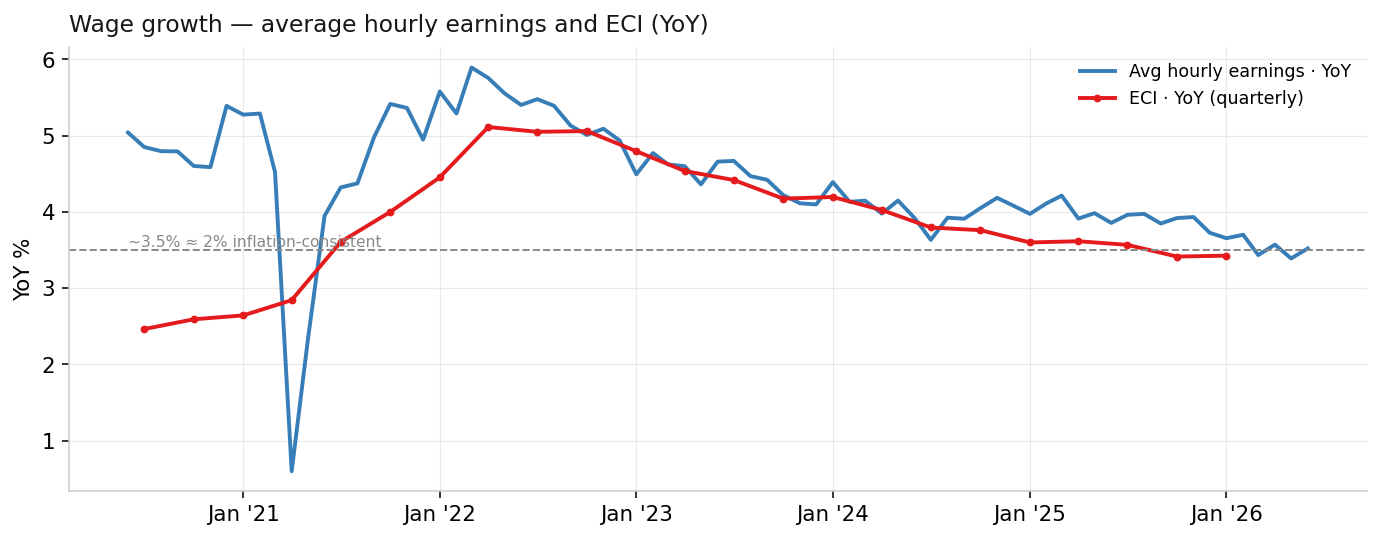
V/U ratio1.04openings ÷ unemployed
Openings7.6M
Quits rate1.9%leads wages
Hires3.3%
Layoffs1.1%
V/U ratio and quits rate
V/U ratio (job openings ÷ unemployed) and the quits rate — falling quits lead falling wage growth.

Wages

AHE · YoY3.5%
AHE · MoM0.35%
ECI · YoY3.4%Fed-preferred · quarterly
Avg weekly hours34.3early-warning
Wage growth — AHE and ECI YoY
Average hourly earnings (YoY) and the Employment Cost Index (YoY, quarterly, higher quality).