Macro-Regime AA
Current Allocation
| Category | Security | Ticker | Weight | vs prev month-end |
|---|---|---|---|---|
| Cash | Cash (SHY/T-bills) | Cash | 0.0% | 0.0%p |
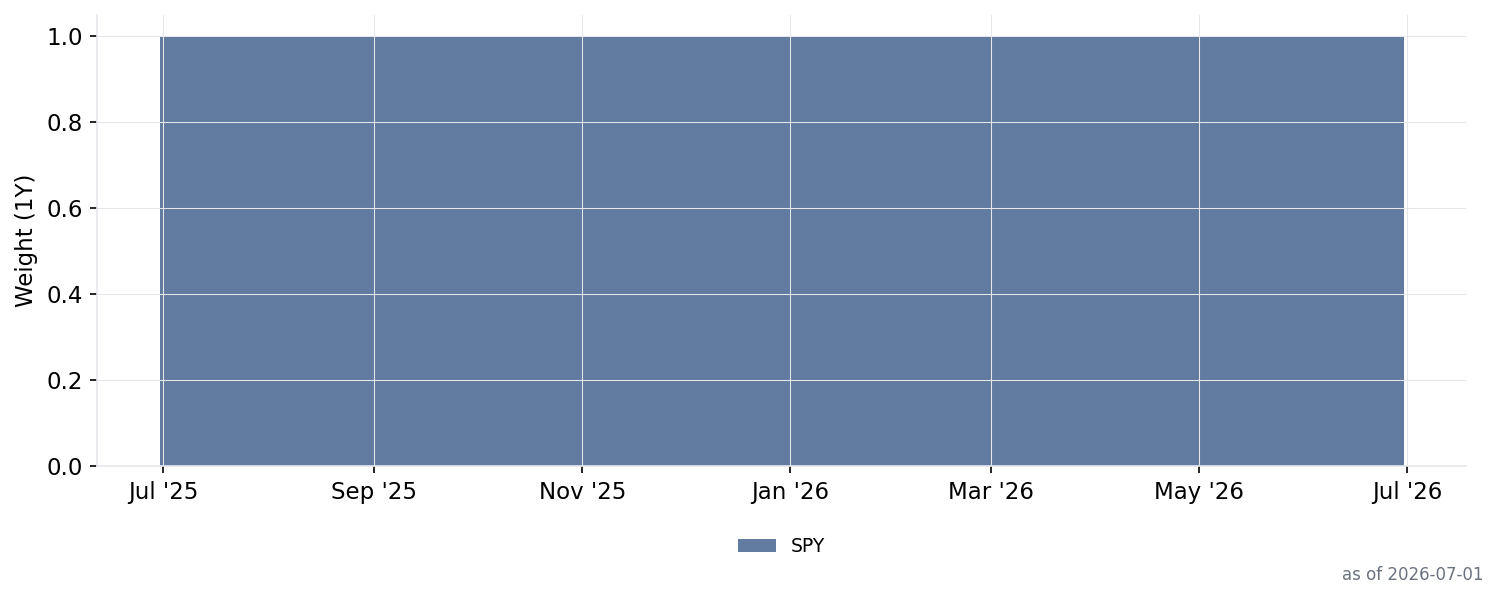
| Equity | SPDR S&P 500 | SPY | 100.0% | 0.0%p |
Weight change vs previous month-end rebalance (2026-05-31).
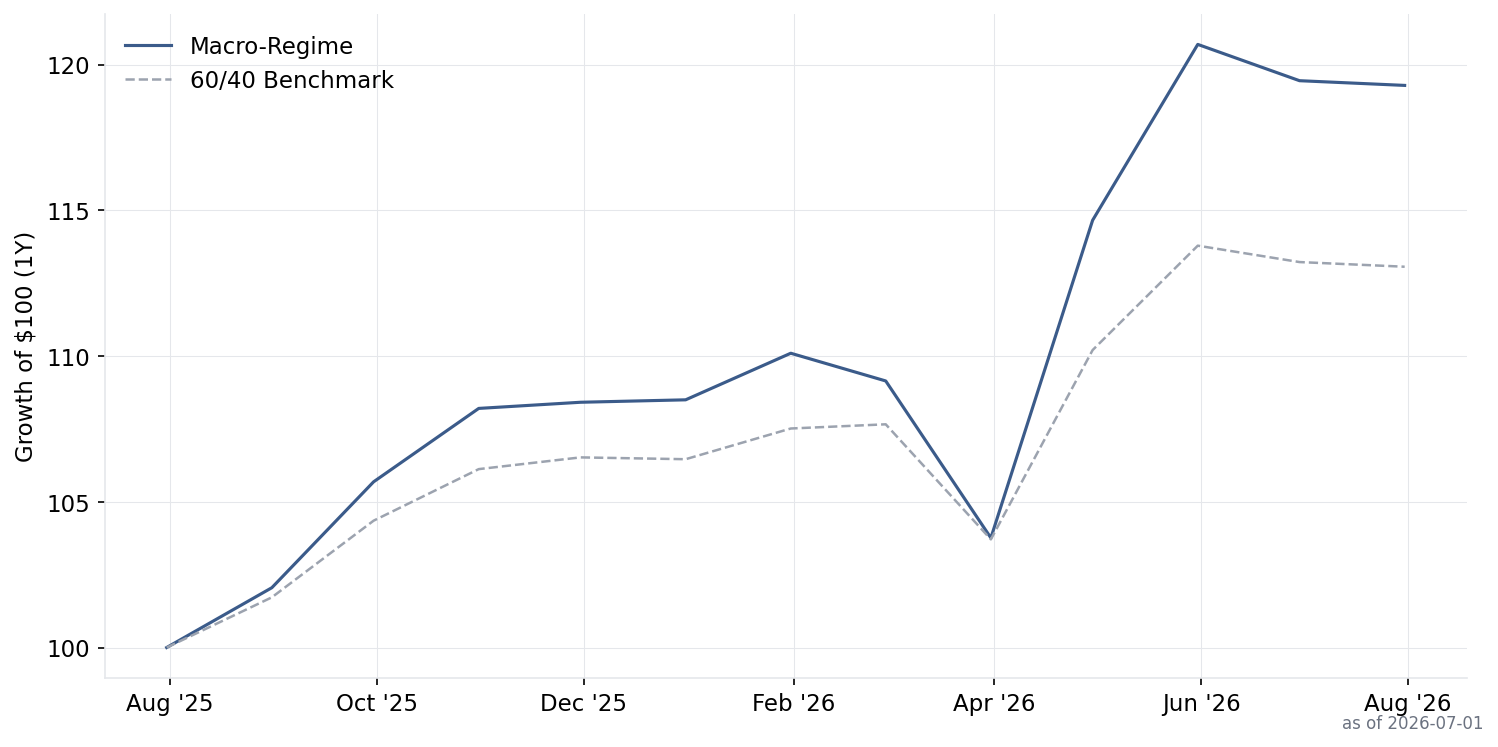
Performance vs 60/40
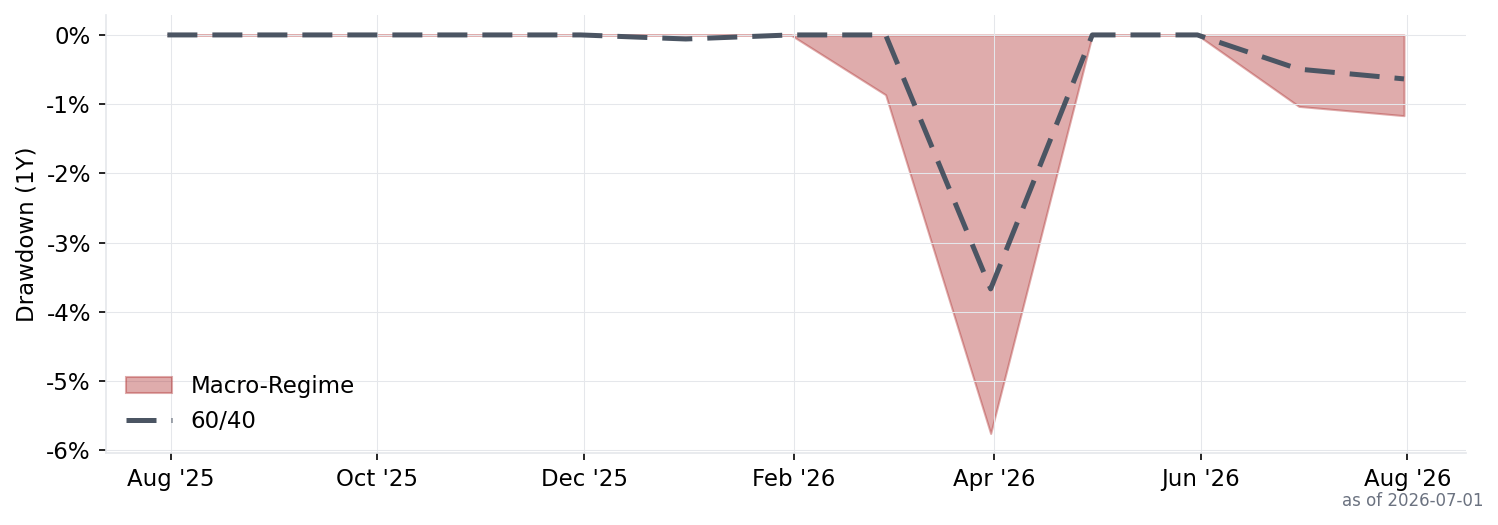
Drawdown
Allocation History
Latest month-end signals
Signals are evaluated once a month at month-end; they do not update intraday.
| Signal | Security | Indicator | Status | Signal Date |
|---|---|---|---|---|
| Market Trend | — | SPY: 745.76 vs SMA10M: 701.58 | BULLISH | 2026-07-31 |
| Economic Trend | — | UNRATE: 4.3% vs 12M MA: 4.32% | OK | 2026-07-31 |
| Regime | — | Holding: SPY | RISK-ON | 2026-07-31 |
Strategy Details
Inspired by Philosophical Economics' "Growth-Trend Timing" approach (~2016). This is the simplest strategy in the set: a binary regime switch between 100% equities and 100% Treasuries. It combines a market trend signal (SPY vs. its moving average) with an economic signal (unemployment rate trend). The key insight is that both signals must be bearish simultaneously to trigger a risk-off switch. A rising market OR a healthy economy is enough to stay in equities. This "both must agree" filter dramatically reduces false signals compared to trend-only models.
Asset Universe
- Risk-ON Asset
- SPY (US equity — S&P 500)
- Risk-OFF Asset
- IEF (7-10 Year US Treasuries)
Scoring Formula
Two independent signals: (1) SPY price vs. 10-month SMA, (2) US unemployment rate (UNRATE) vs. its 12-month moving average
Decision Rules
- Signal 1 — Market Trend: SPY > 10M SMA → bullish
- Signal 2 — Economic Trend: UNRATE > 12M MA → deteriorating (bearish)
- RISK-ON (100% SPY): if market trend is bullish OR economy is not deteriorating
- RISK-OFF (100% IEF): only when BOTH market is bearish AND economy is deteriorating
- Requires dual confirmation to exit equities — reduces false signals
Signal Charts (1Y)
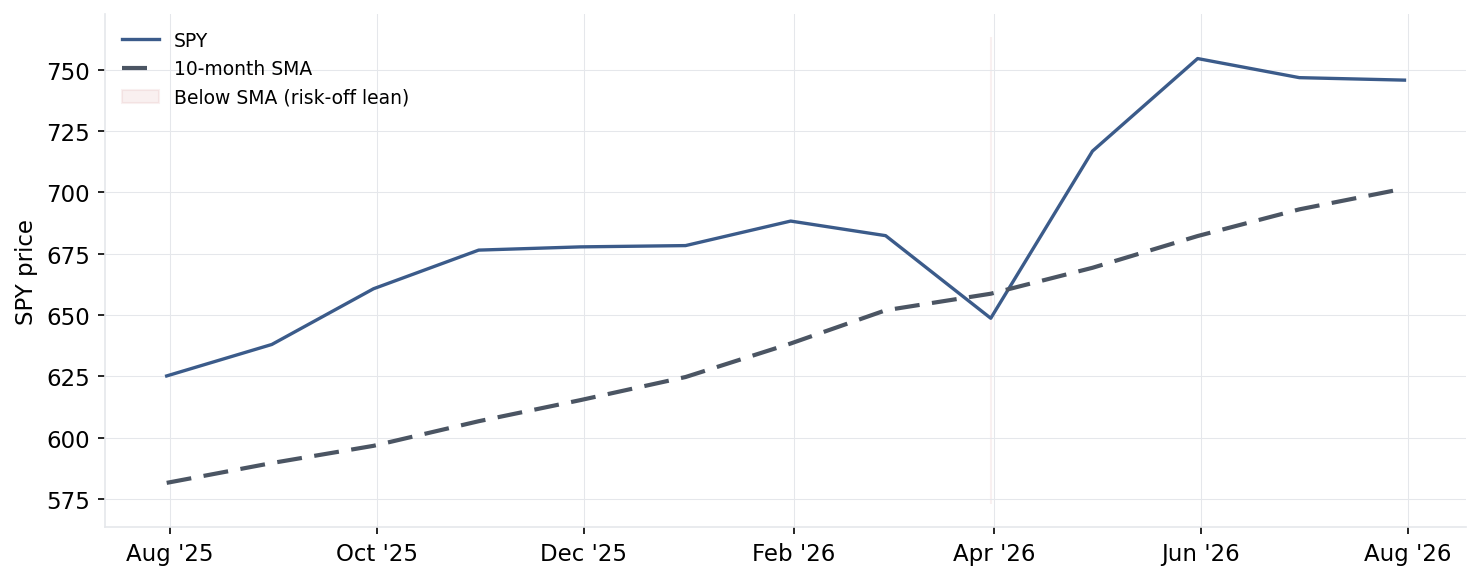
Market Trend — SPY vs 10-month SMA
Economic Trend — Unemployment vs 12-month MA
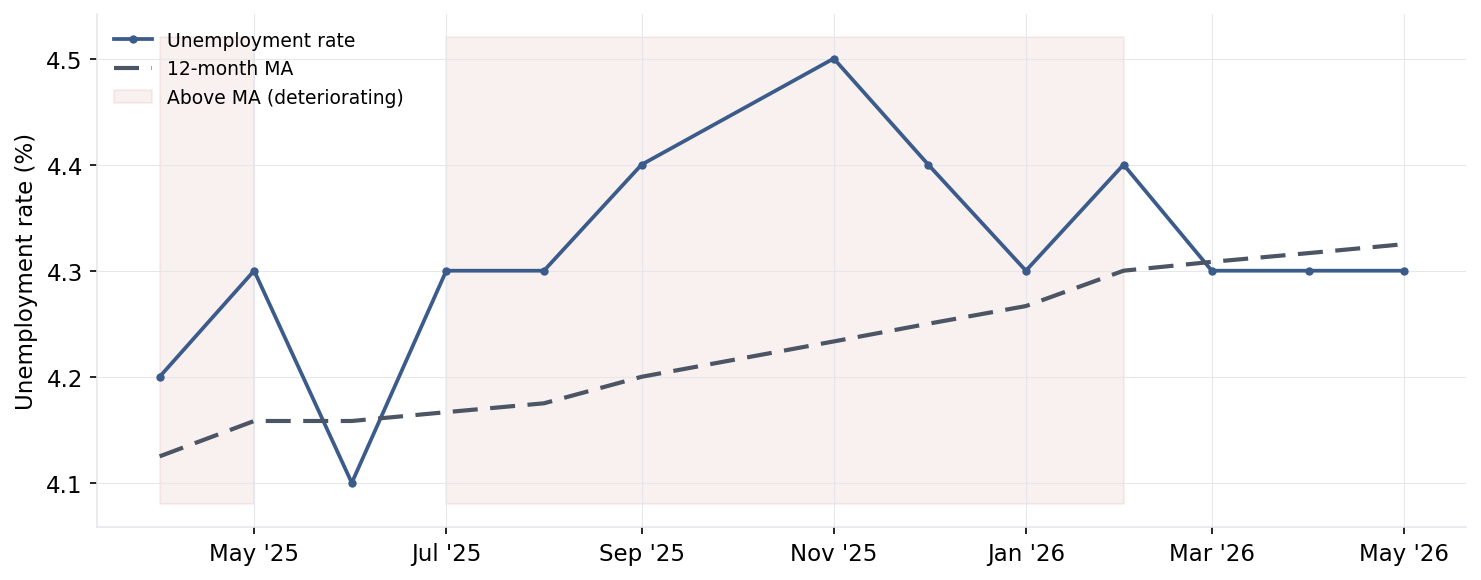
Risk-OFF (100% IEF) triggers only when BOTH signals are bearish: SPY below its 10M SMA AND unemployment above its 12M MA.
Source
Philosophical Economics, 'Growth-Trend Timing' (~2016); various adaptations of unemployment-based regime switching — Paper
Caveats
- Standard backtest caveats apply: no slippage modeled beyond 5bps cost, dividends reinvested via adjusted prices.
Data: Alpha Vantage (prices), FRED (unemployment). Transaction cost: 5bps/trade. Backtest: 2003-01-31 to 2026-07-01. Generated: 2026-07-02 09:30:55.