Bond — Market
Fixed-income dashboard — a bond-ETF relative-rotation screen vs AGG (US Aggregate), US & Korea yield curves, an HY-vs-IG credit-quality monitor, and a 2s10s curve-shape gauge.
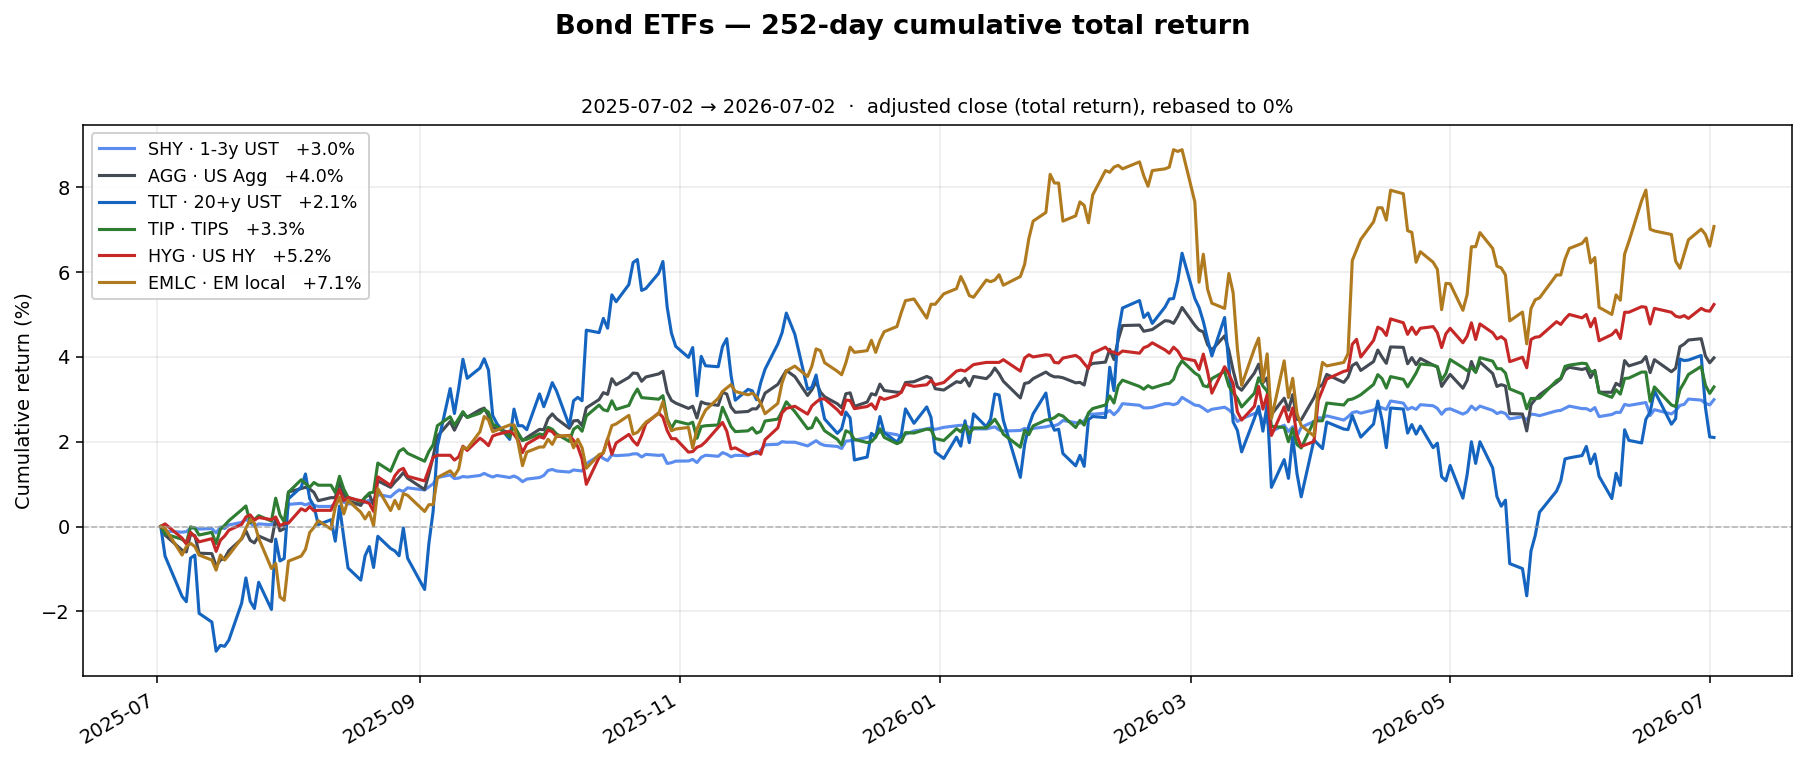
Fixed-Income Performance — 252-day cumulative return
2025-07-02 → 2026-07-02 · adjusted close (total return), rebased to 0% · click to enlarge
SHY +3% · AGG +4% · TLT +2.1% · TIP +3.3% · HYG +5.2% · EMLC +7.1%
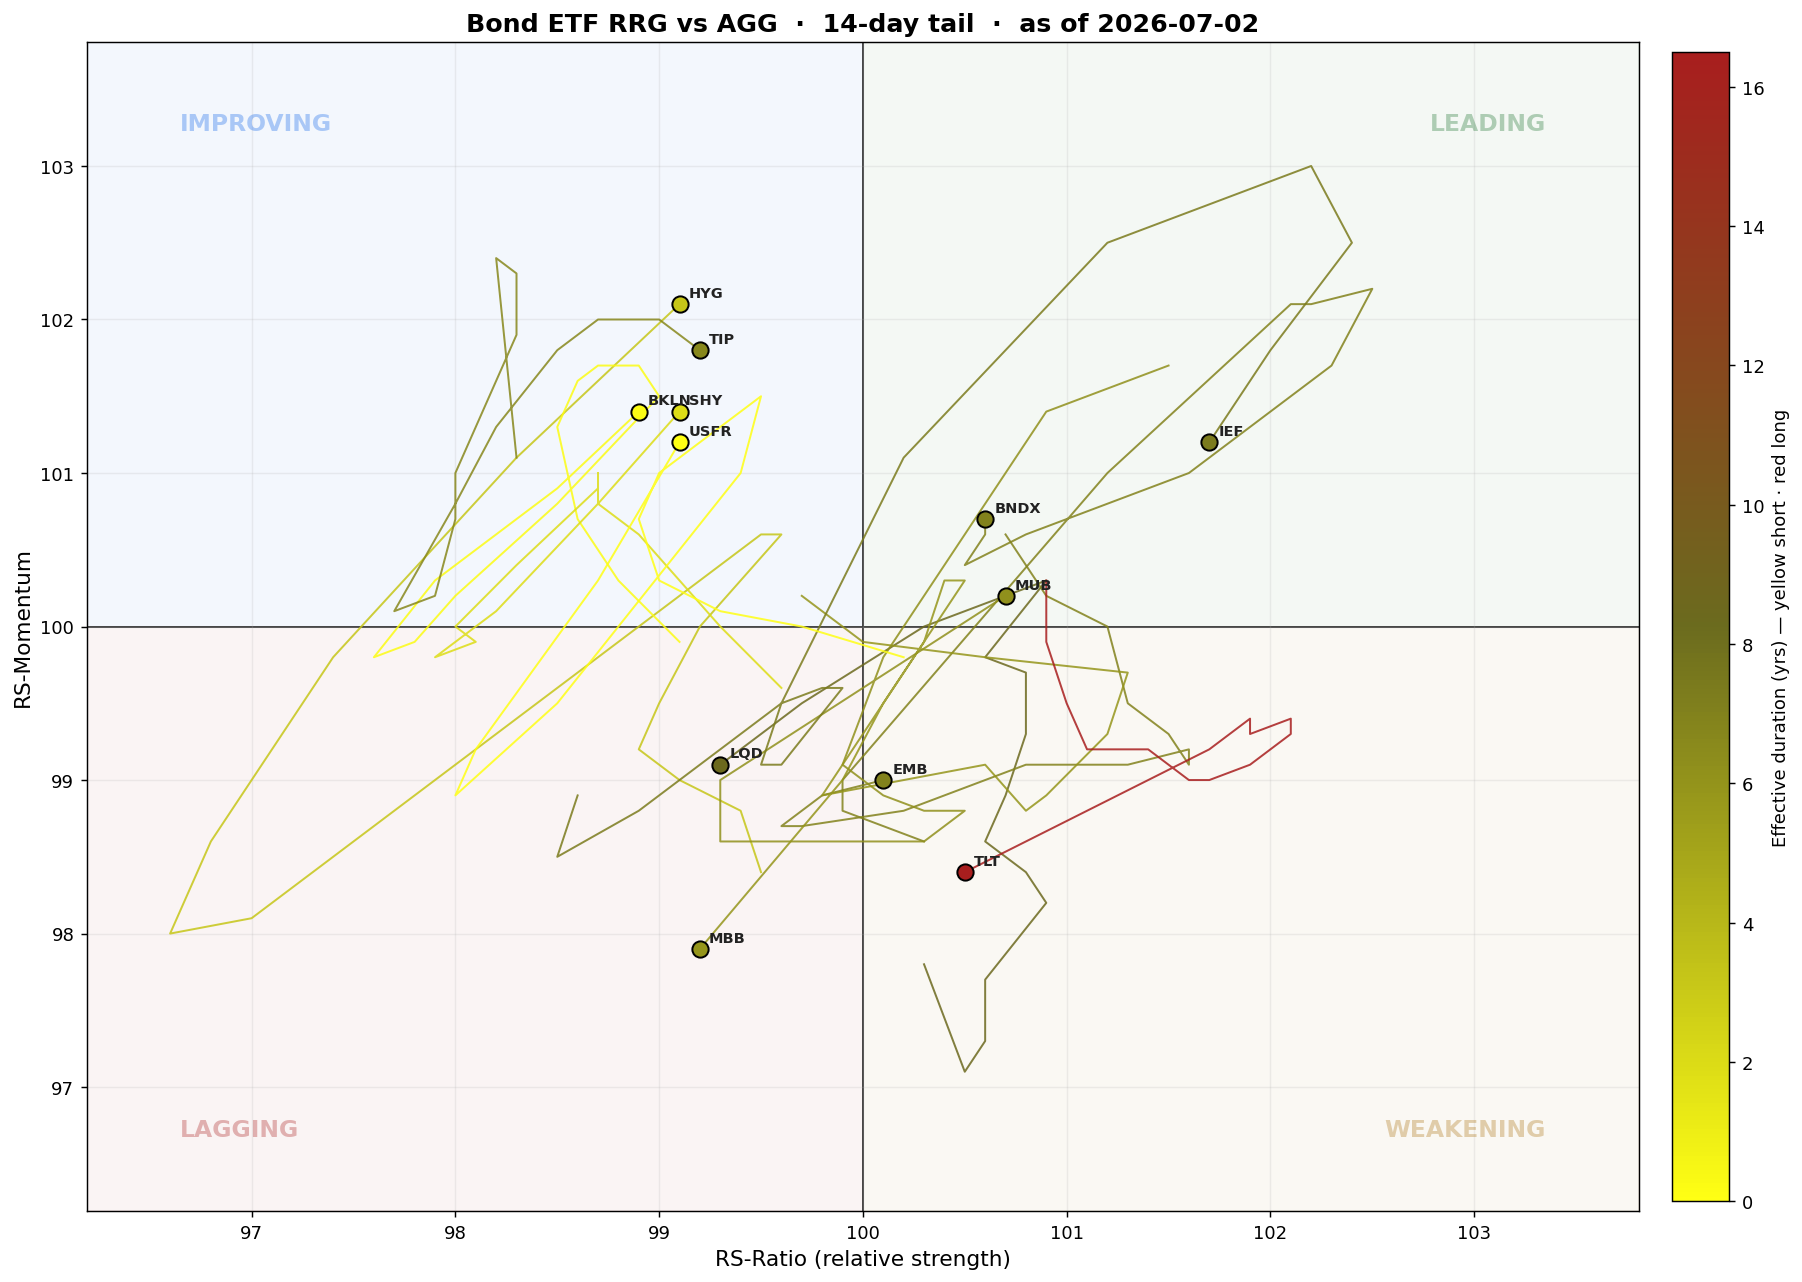
Bond ETF Rotation (RRG vs AGG)
As of 2026-07-02 · 12 ETFs · 14-day tail · click to enlarge
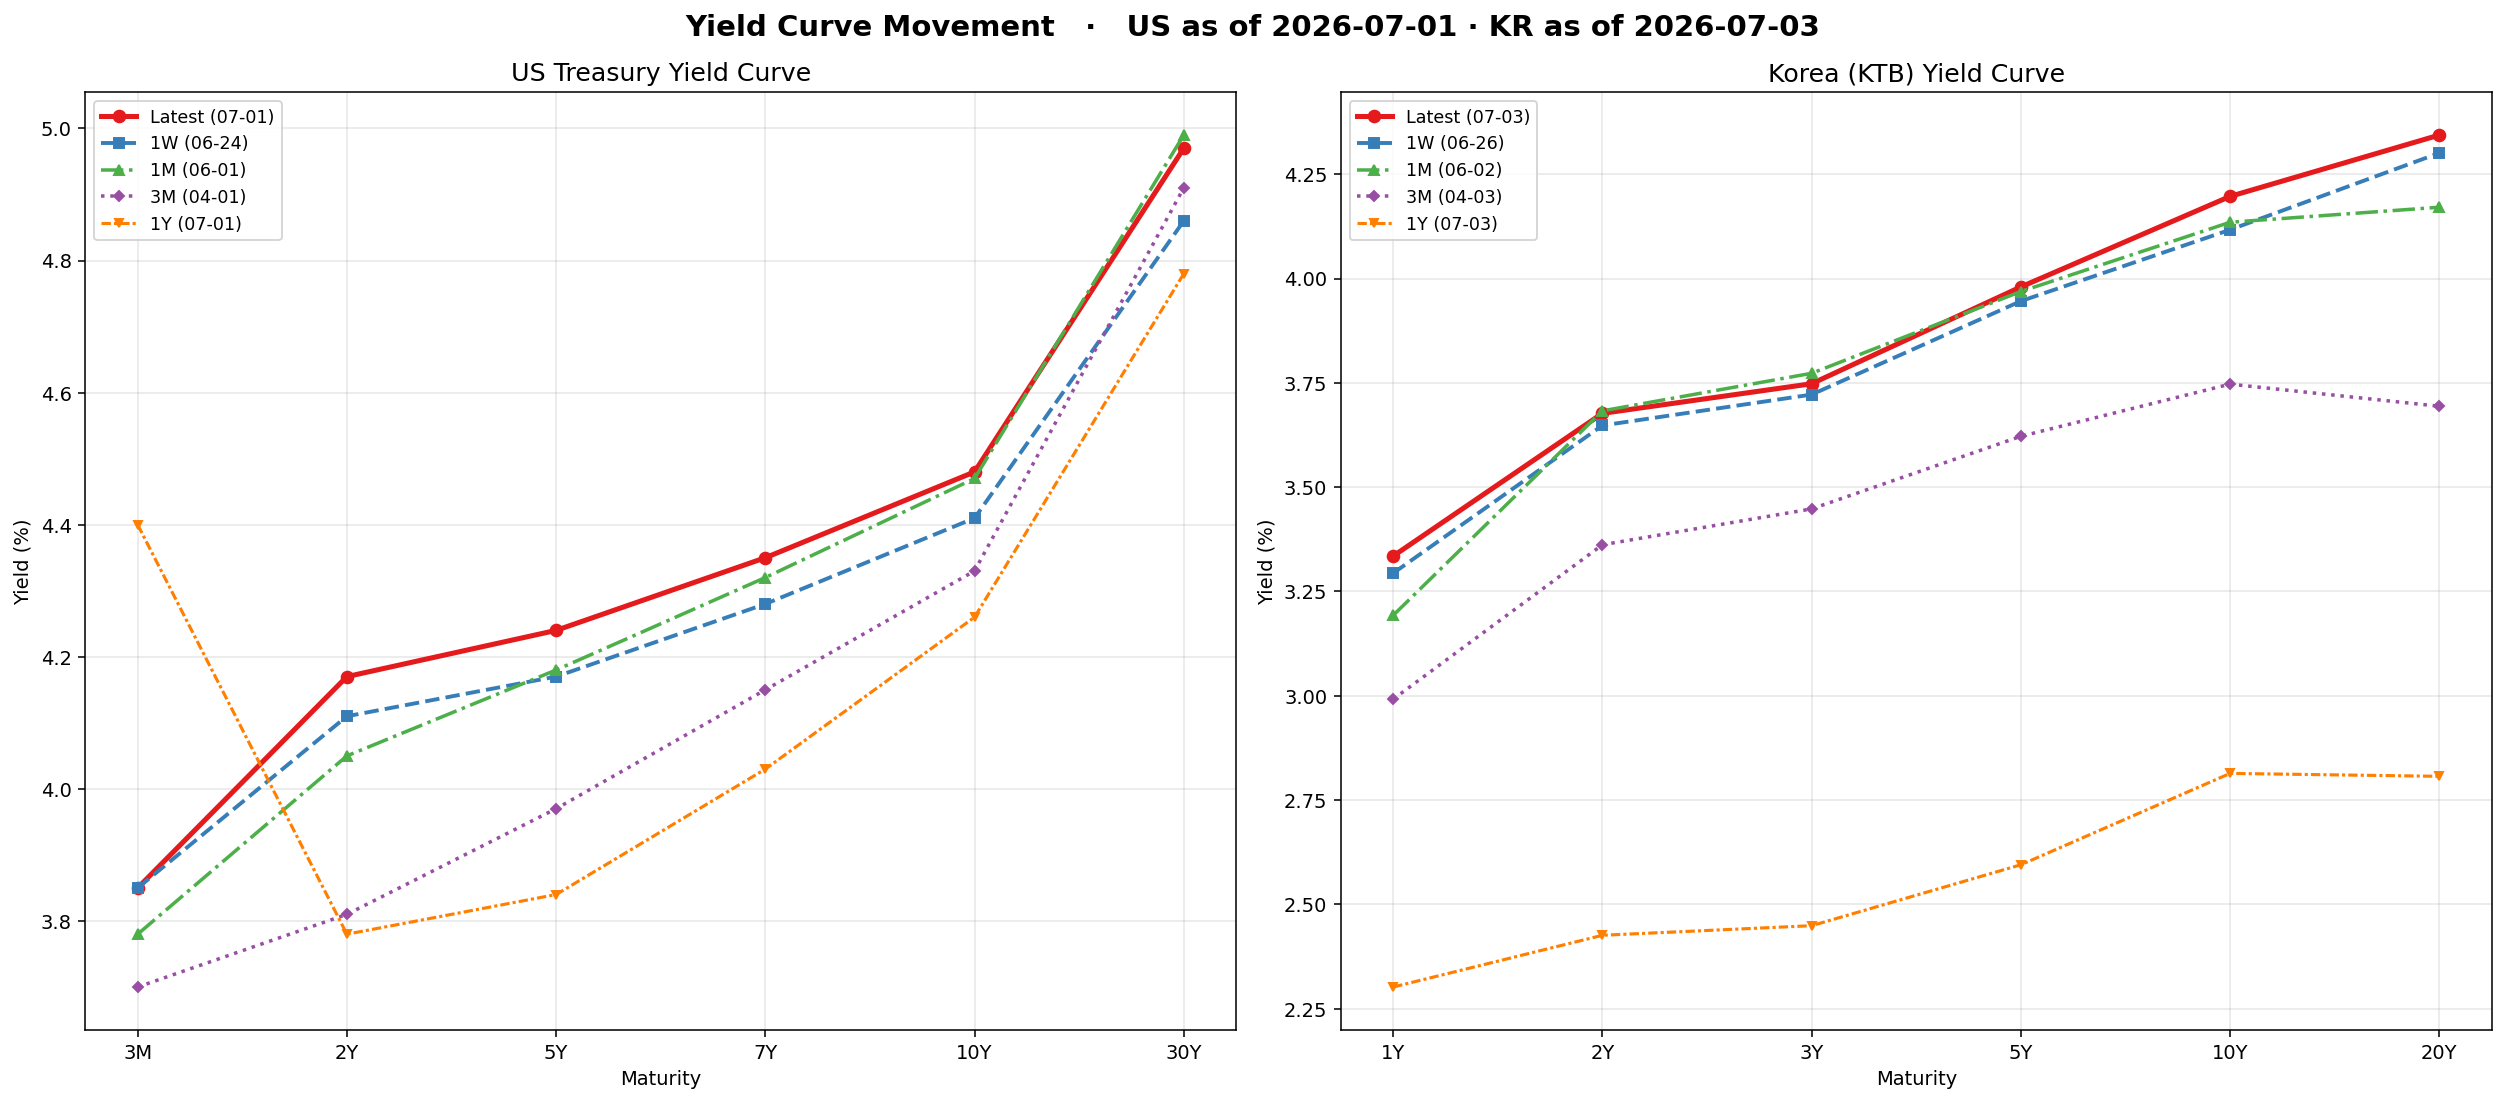
Yield Curves
US as of 2026-07-01 (Alpha Vantage Treasury) · Korea as of 2026-07-03 (BOK ECOS) · click to enlarge
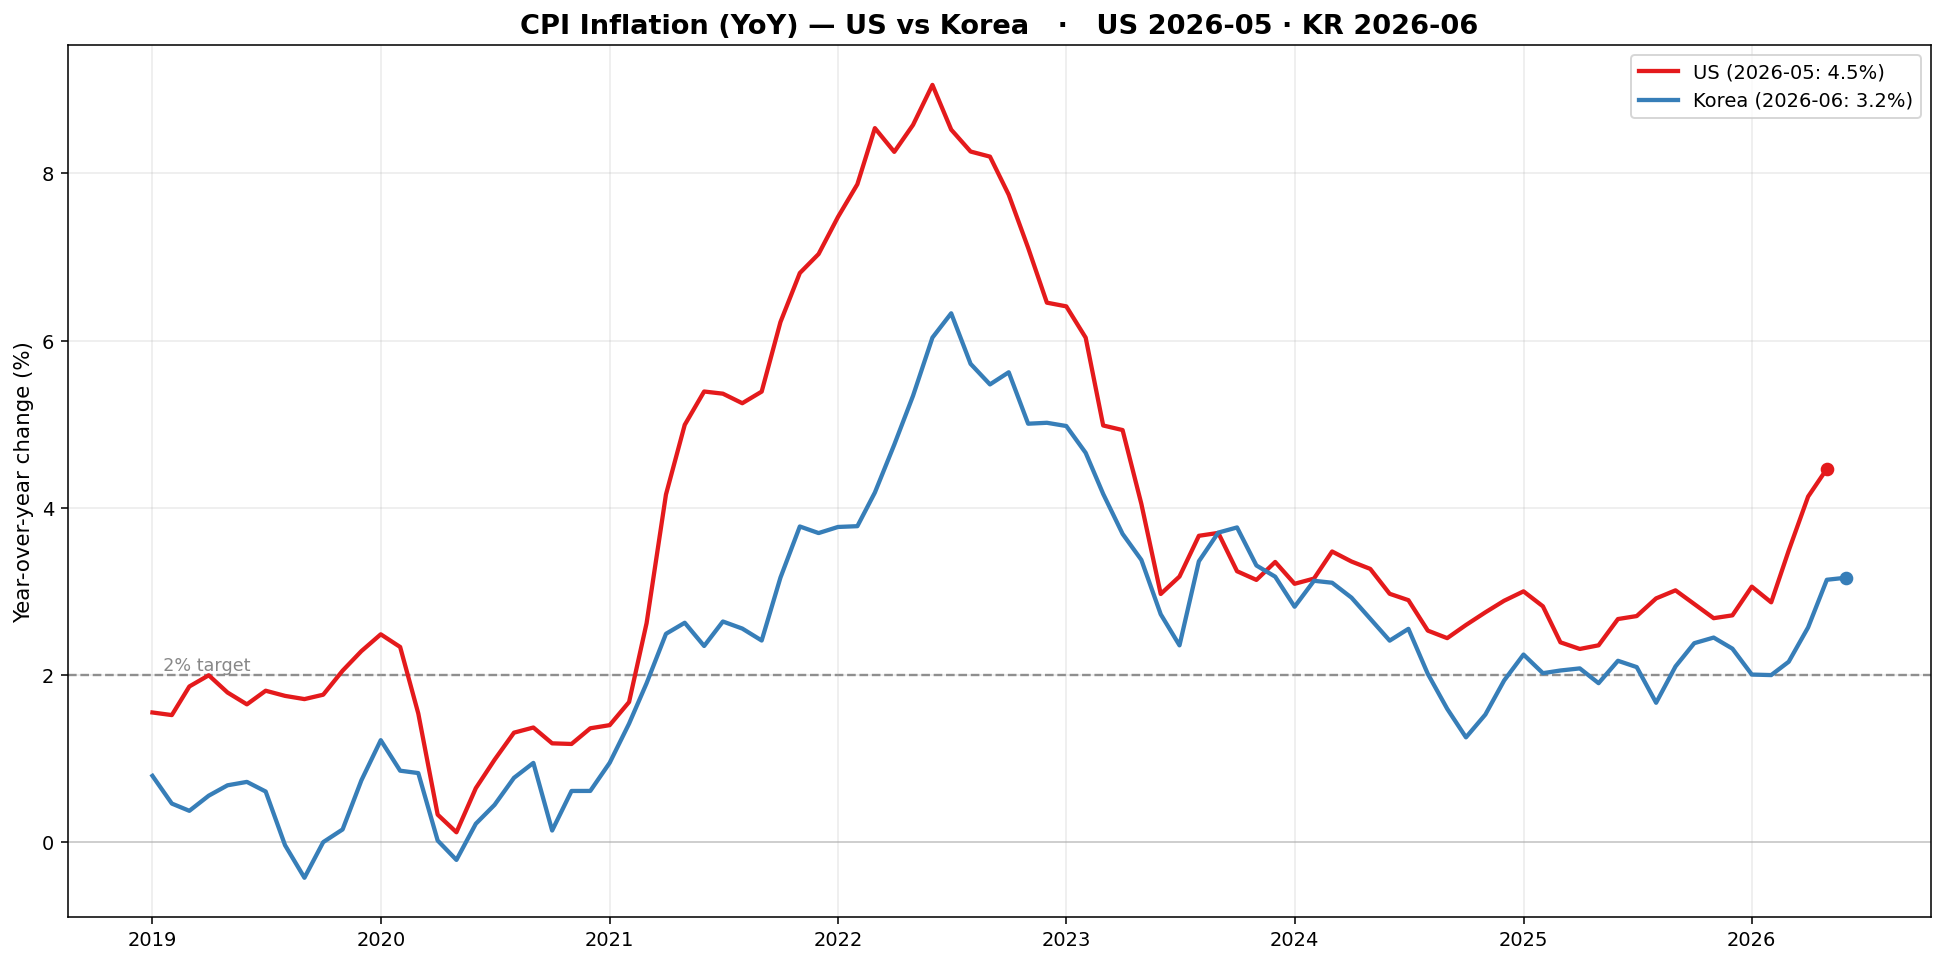
Inflation — CPI (YoY)
US as of 2026-05 (Alpha Vantage CPI) · Korea as of 2026-06 (BOK ECOS) · click to enlarge
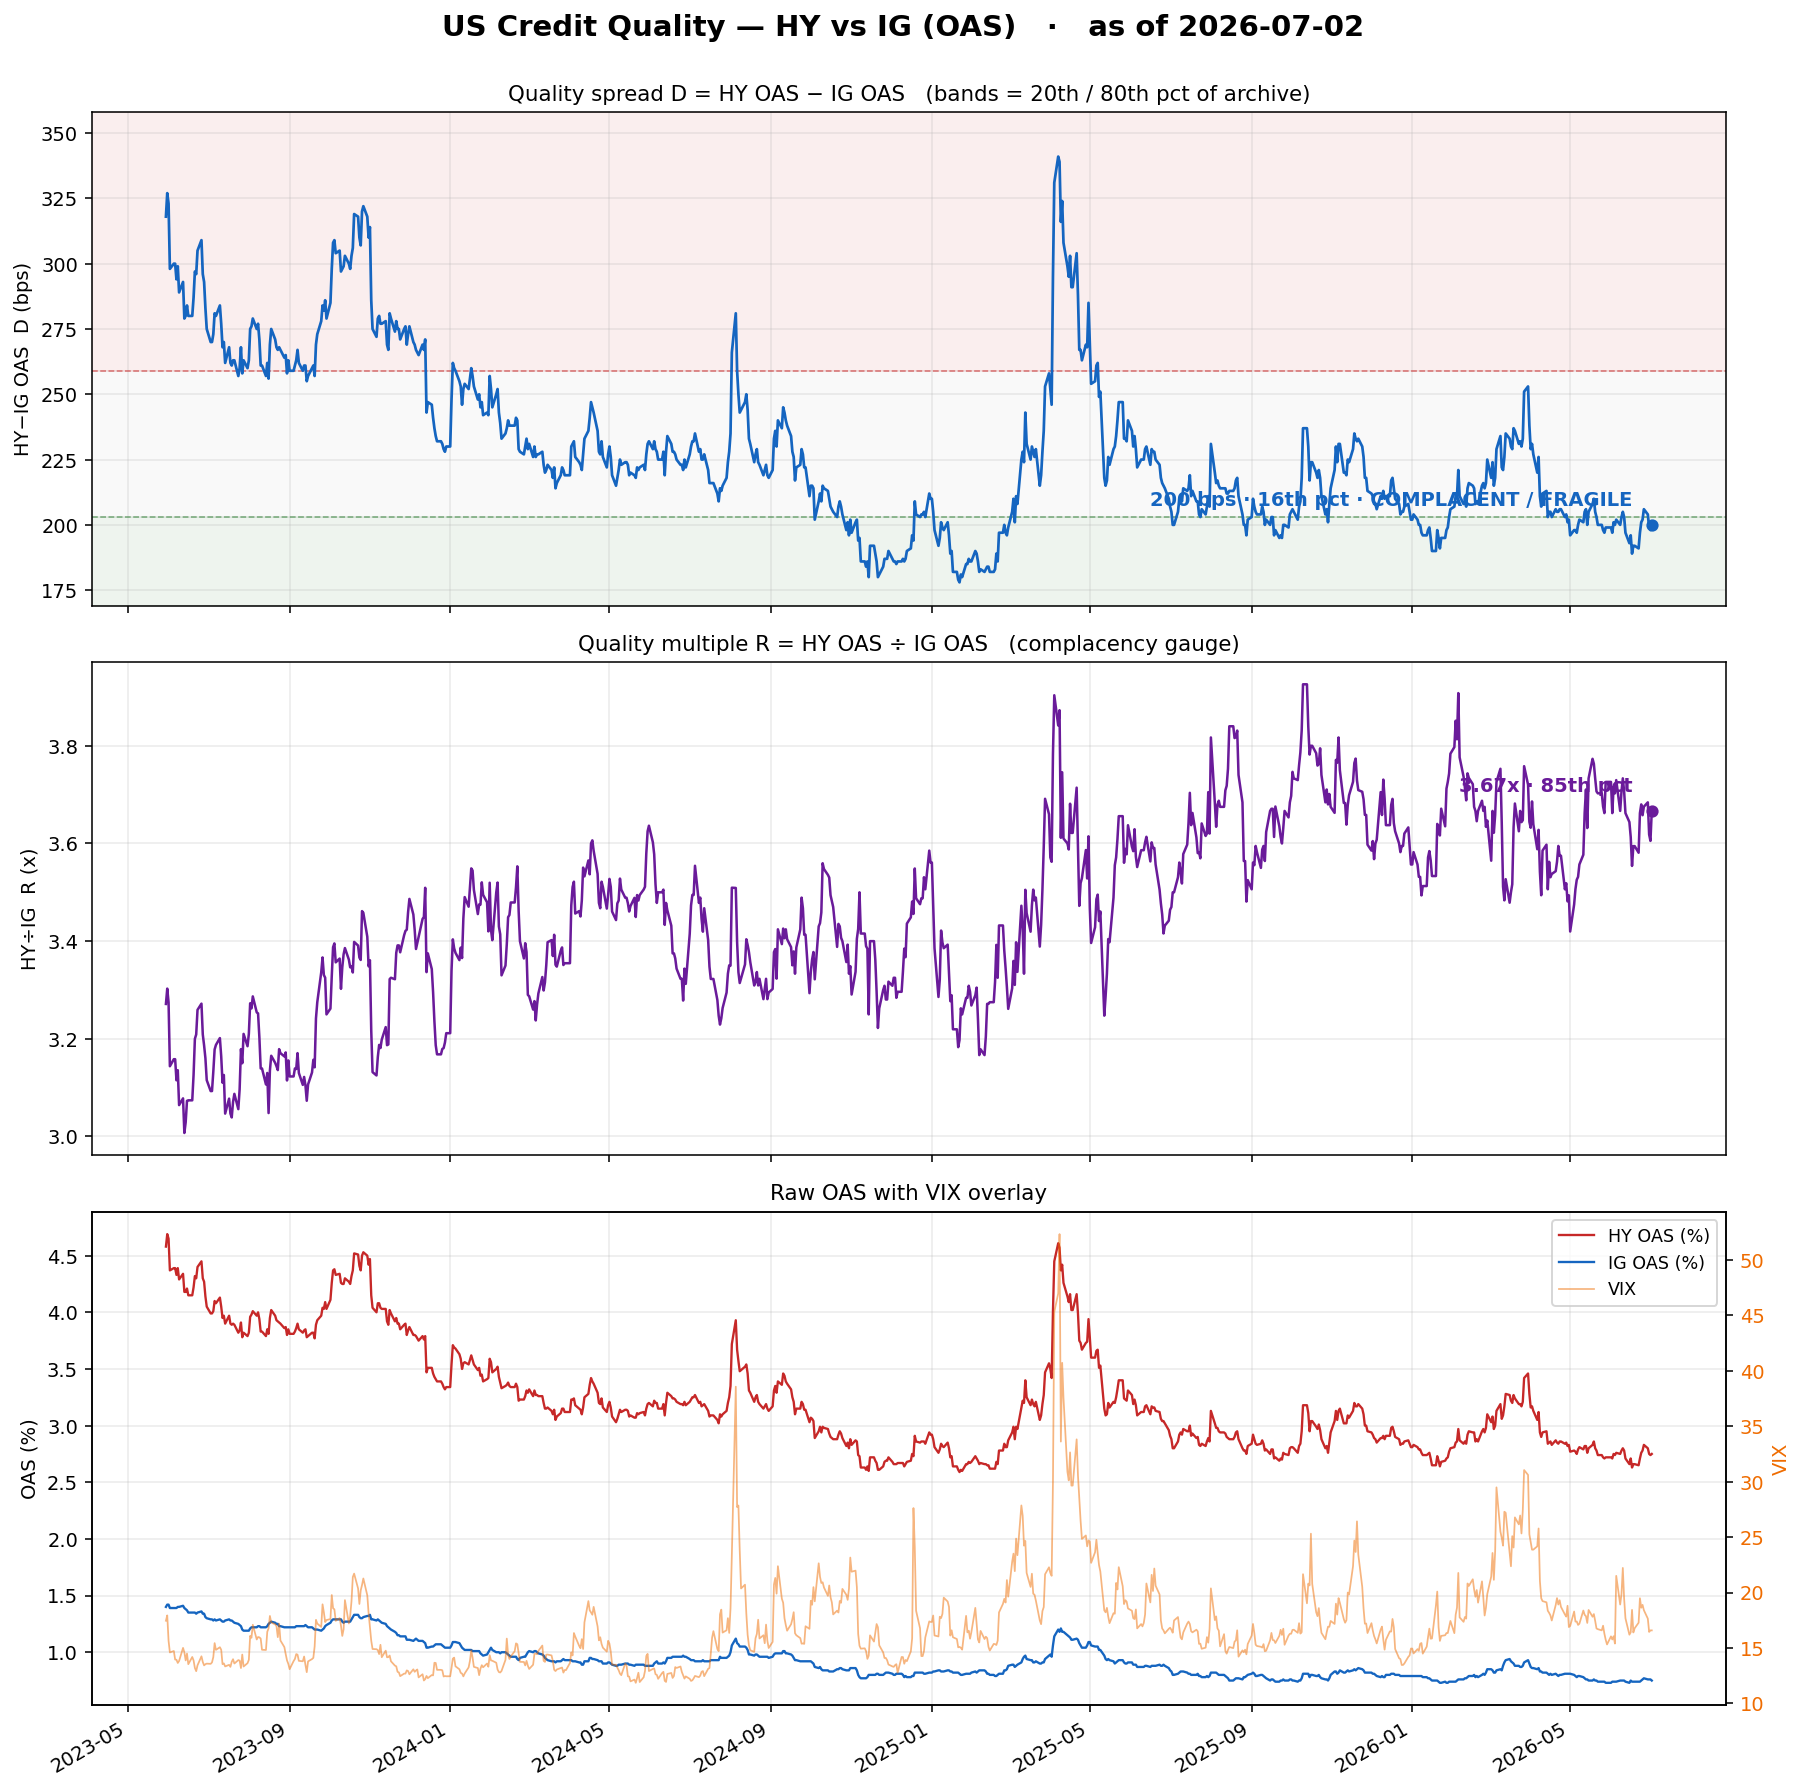
Credit Quality — HY vs IG (OAS)
As of 2026-07-02 · archive 2023-05-30 → 2026-07-02 (808 obs) · option-adjusted spreads only (duration-neutral — measures credit, not rates) · click to enlarge
D = HY−IG = 200 bps (16th pct) · R = HY÷IG = 3.67× (85th pct) · HY 2.75% · IG 0.75% · VIX 16.59 · Δ20d 0 / Δ60d -7 bps · regime COMPLACENT / FRAGILE
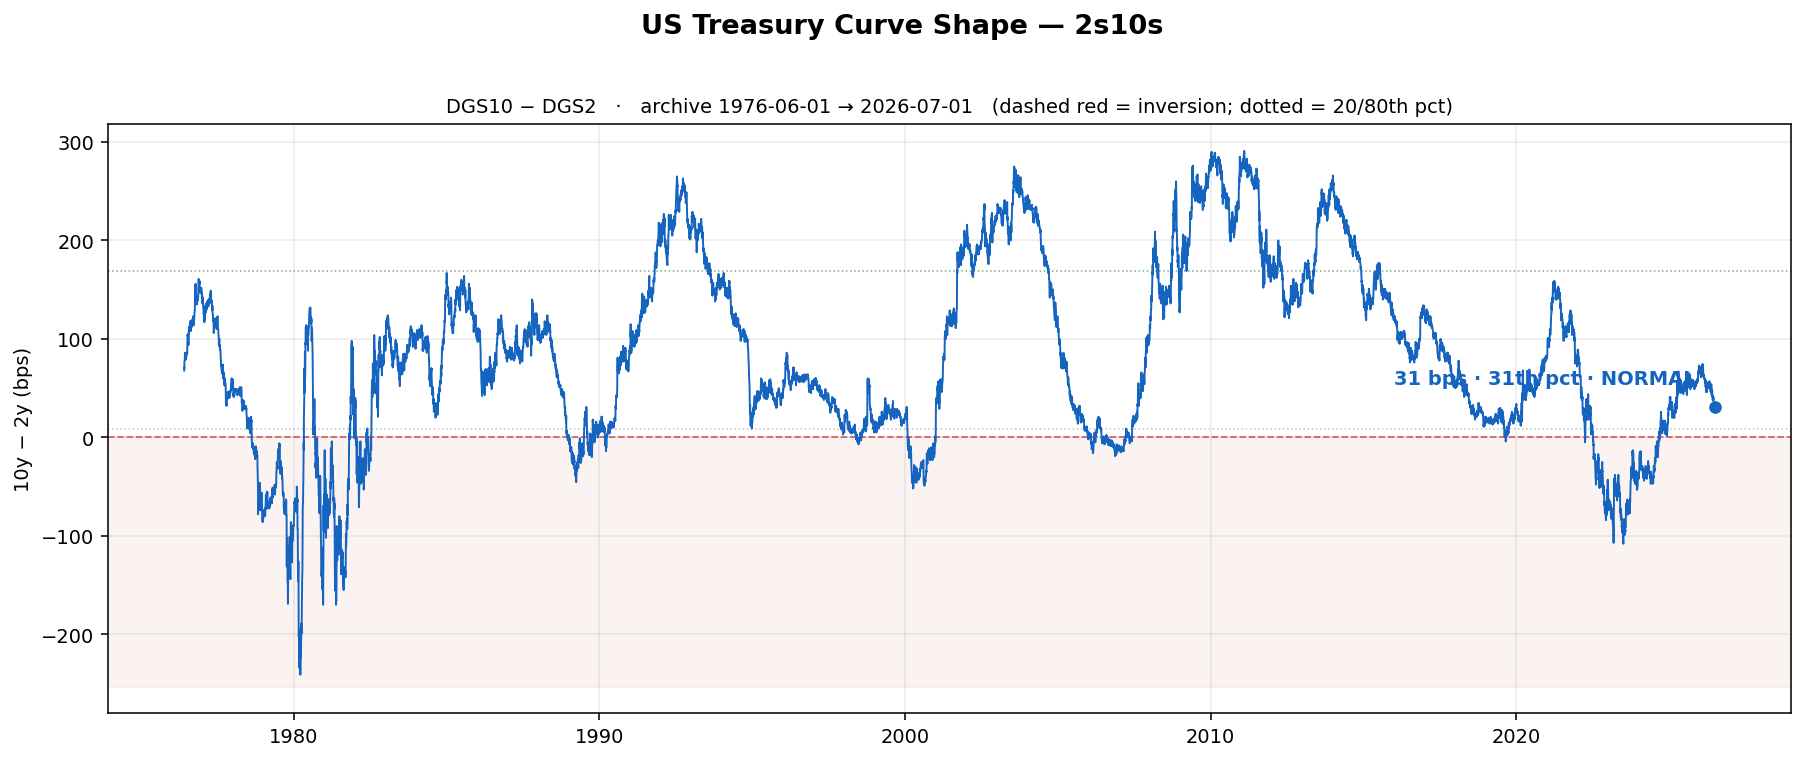
Curve Shape — 2s10s
As of 2026-07-01 · 31th pct of full history (1976-06-01 → 2026-07-01) · click to enlarge
2s10s = 31 bps · 2y 4.17% · 10y 4.48% · regime NORMAL
Bond ETF Screen (12)
Sortable. Category is the broad sleeve, Sub-Category the detailed segment. Quadrant / RS-Ratio / RS-Mom from the RRG vs AGG.
| Ticker | Name | Inception | AUM | Category | Sub-Category | Quadrant | RS-Ratio | RS-Mom | Roundness | Score | 5D | 20D | MTD | 200D | YTD | 52W Range | Rotation |
|---|---|---|---|---|---|---|---|---|---|---|---|---|---|---|---|---|---|
| HYG | iShares iBoxx HY Corporate Bond ETF | 2007-04-04 | $16.1B | High Yield | High-Yield Corporate | Improving | 99.08 | 102.08 | 0.30 | 2.5 | +0.3% | +0.5% | +0.1% | +3.1% | +1.8% | 100% | |
| BKLN | Invesco Senior Loan ETF | 2011-03-03 | $7.2B | High Yield | Senior Loans | Improving | 98.87 | 101.37 | 0.53 | 1.4 | +0.2% | −0.3% | −0.1% | +2.2% | −0.1% | 87% | |
| LQD | iShares iBoxx IG Corporate Bond ETF | 2002-07-22 | $29.8B | IG Corporate | IG Corporate | Lagging | 99.29 | 99.08 | 0.97 | 1.8 | −0.4% | +0.4% | −0.0% | +0.4% | +0.8% | 85% | |
| TIP | iShares TIPS Bond ETF | 2003-12-04 | $15.1B | Inflation | TIPS | Improving | 99.19 | 101.85 | 0.97 | 2.3 | −0.1% | −0.3% | −0.0% | +0.6% | +1.2% | 84% | |
| EMB | iShares JP Morgan USD EM Bond ETF | 2007-12-17 | $14.2B | International | EM USD Bond | Weakening | 100.11 | 99.00 | 0.46 | 0.8 | +0.0% | +0.7% | +0.2% | +5.0% | +2.5% | 98% | |
| BNDX | Vanguard Total International Bond ETF | 2013-05-31 | $122.0B | International | Intl Developed (Hedged) | Leading | 100.57 | 100.66 | -0.56 | 0.0 | −0.3% | +0.7% | −0.2% | +1.5% | +1.2% | 76% | |
| MUB | iShares National Muni Bond ETF | 2007-09-07 | $44.9B | Municipal | National Muni | Leading | 100.73 | 100.18 | 0.77 | 1.0 | +0.2% | +0.7% | +0.2% | +3.5% | +2.0% | 100% | |
| MBB | iShares MBS ETF | 2007-03-13 | $38.7B | Securitized | Mortgage-Backed | Lagging | 99.16 | 97.90 | -0.14 | 0.0 | −0.5% | +0.4% | −0.1% | +1.9% | +1.0% | 84% | |
| TLT | iShares 20+ Year Treasury Bond ETF | 2002-07-22 | $42.9B | Treasury | Long-Term Treasury (20Y+) | Weakening | 100.52 | 98.38 | 0.46 | 1.6 | −1.7% | +0.6% | −0.7% | −1.6% | +0.3% | 54% | |
| SHY | iShares 1-3 Year Treasury Bond ETF | 2002-07-22 | $25.4B | Treasury | Short-Term Treasury (1-3Y) | Improving | 99.15 | 101.44 | 0.28 | 0.9 | +0.1% | +0.3% | +0.1% | +1.8% | +0.7% | 98% | |
| IEF | iShares 7-10 Year Treasury Bond ETF | 2002-07-22 | $48.3B | Treasury | Intermediate Treasury (7-10Y) | Leading | 101.68 | 101.18 | -0.02 | 0.0 | −0.4% | +0.5% | −0.1% | +0.0% | −0.2% | 62% | |
| USFR | WisdomTree Floating Rate Treasury Fund | 2014-02-04 | $17.0B | Treasury | Floating Rate Treasury | Improving | 99.09 | 101.22 | -0.01 | 0.0 | +0.1% | +0.3% | +0.0% | +3.2% | +1.9% | 100% |